| Red | Green | Blue | |
| z | 17.64 | ||
| znorm | Inf | ||
| sky | -Inf | -Inf | -Inf |
| S/N | 21.7 | 37.5 | 42.2 |
| S/N(c) | 0.0 | 0.0 | 0.0 |
| SN(E/C) |
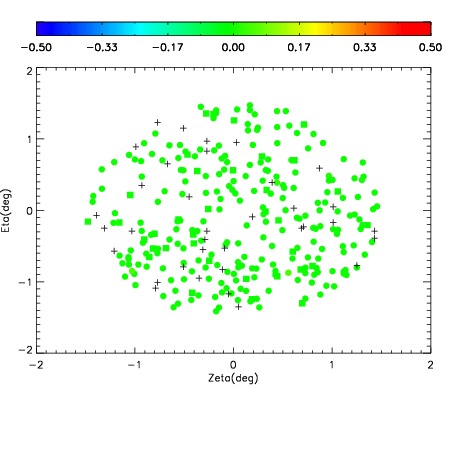
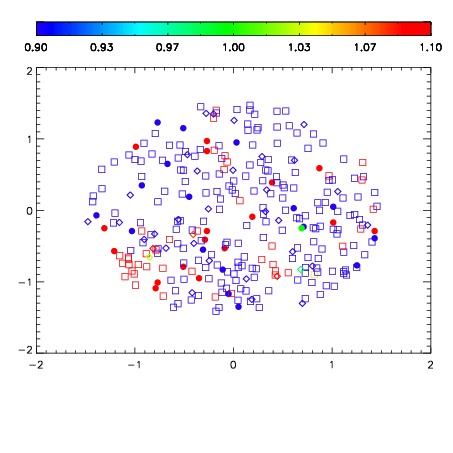
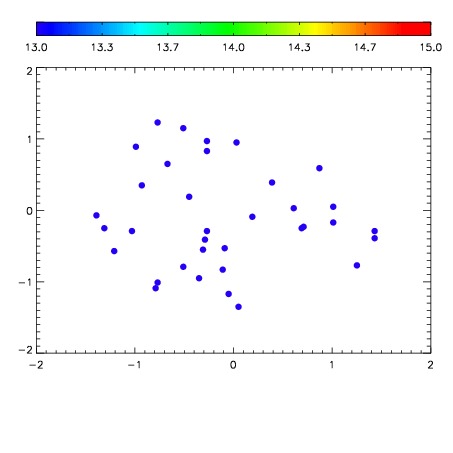

| Frame | Nreads | Zeropoints | Mag plots | Spatial mag deviation | Spatial sky 16325A emission deviations (filled: sky, open: star) | Spatial sky continuum emission | Spatial sky telluric CO2 absorption deviations (filled: H < 10) | |||||||||||||||||||||||
| 0 | 0 |
|
|
|
|
|
|
| IPAIR | NAME | SHIFT | NEWSHIFT | S/N | NAME | SHIFT | NEWSHIFT | S/N |
| 0 | 18620017 | 0.507454 | 0.00000 | 17.7766 | 18620018 | 0.00451476 | 0.502939 | 17.9142 |
| 1 | 18620012 | 0.503402 | 0.00405198 | 18.7620 | 18620011 | 0.00000 | 0.507454 | 18.7378 |
| 2 | 18620020 | 0.503039 | 0.00441498 | 18.2371 | 18620019 | 0.00280121 | 0.504653 | 18.2624 |
| 3 | 18620016 | 0.505561 | 0.00189298 | 18.2185 | 18620015 | 0.00317581 | 0.504278 | 18.2360 |
| 4 | 18620013 | 0.504886 | 0.00256801 | 18.1257 | 18620014 | 0.00222407 | 0.505230 | 18.1887 |