| Red | Green | Blue | |
| z | 17.64 | ||
| znorm | Inf | ||
| sky | -Inf | -Inf | -Inf |
| S/N | 27.0 | 45.3 | 52.3 |
| S/N(c) | 0.0 | 0.0 | 0.0 |
| SN(E/C) |
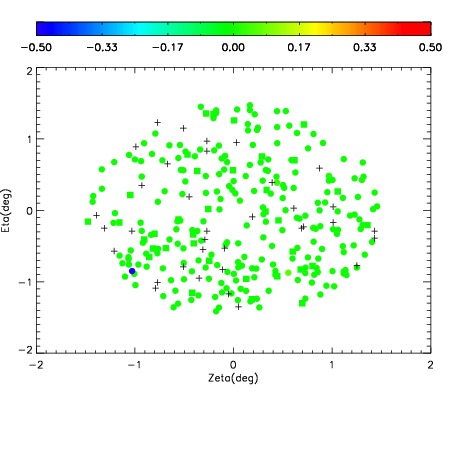
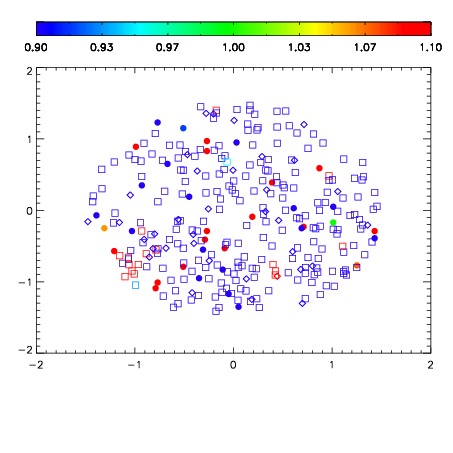
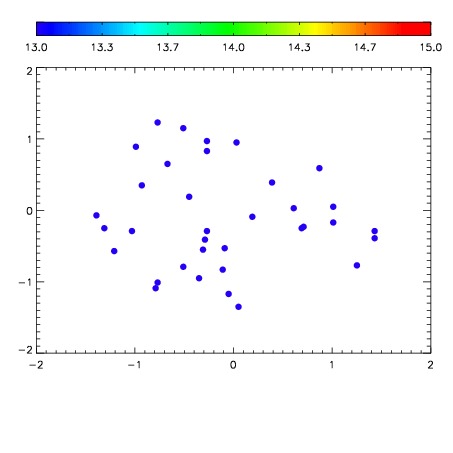

| Frame | Nreads | Zeropoints | Mag plots | Spatial mag deviation | Spatial sky 16325A emission deviations (filled: sky, open: star) | Spatial sky continuum emission | Spatial sky telluric CO2 absorption deviations (filled: H < 10) | |||||||||||||||||||||||
| 0 | 0 |
|
|
|
|
|
|
| IPAIR | NAME | SHIFT | NEWSHIFT | S/N | NAME | SHIFT | NEWSHIFT | S/N |
| 0 | 18630013 | 0.502439 | 0.00000 | 18.3186 | 18630014 | -0.000584222 | 0.503023 | 18.2741 |
| 1 | 18630012 | 0.500464 | 0.00197500 | 19.0444 | 18630011 | 0.00000 | 0.502439 | 18.9844 |
| 2 | 18630020 | 0.500770 | 0.00166905 | 18.6361 | 18630015 | 4.60872e-05 | 0.502393 | 18.5918 |
| 3 | 18630016 | 0.501211 | 0.00122803 | 18.6212 | 18630019 | -0.000872472 | 0.503312 | 18.5860 |
| 4 | 18630017 | 0.499779 | 0.00266004 | 18.4597 | 18630018 | -0.00163592 | 0.504075 | 18.4809 |