| Red | Green | Blue | |
| z | 17.64 | ||
| znorm | Inf | ||
| sky | -Inf | -Inf | -Inf |
| S/N | 10.9 | 21.1 | 24.4 |
| S/N(c) | 0.0 | 0.0 | 0.0 |
| SN(E/C) |
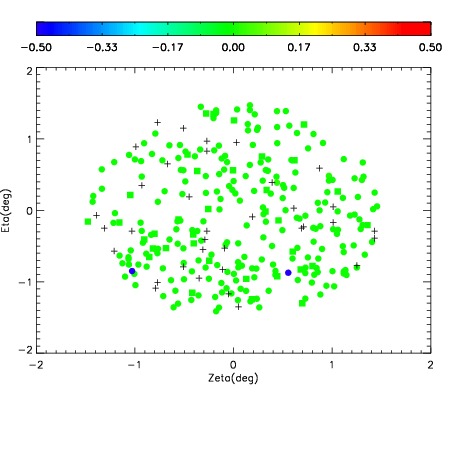
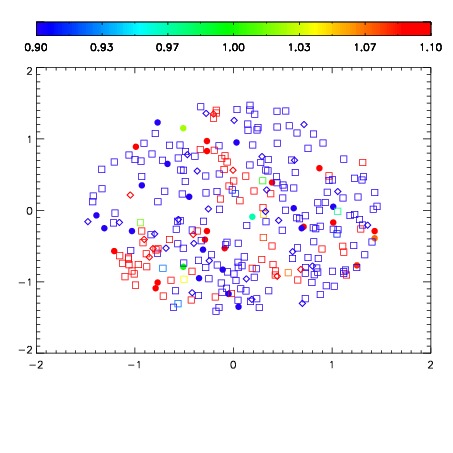
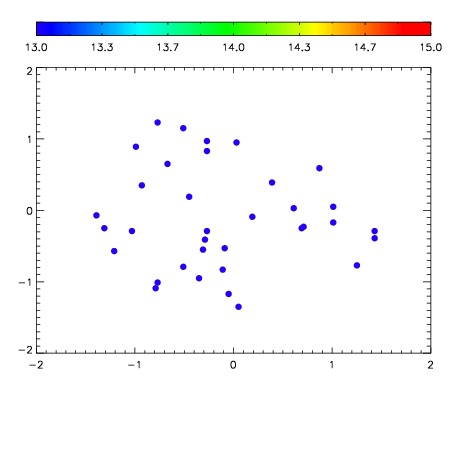

| Frame | Nreads | Zeropoints | Mag plots | Spatial mag deviation | Spatial sky 16325A emission deviations (filled: sky, open: star) | Spatial sky continuum emission | Spatial sky telluric CO2 absorption deviations (filled: H < 10) | |||||||||||||||||||||||
| 0 | 0 |
|
|
|
|
|
|
| IPAIR | NAME | SHIFT | NEWSHIFT | S/N | NAME | SHIFT | NEWSHIFT | S/N |
| 0 | 18640013 | 0.501951 | 0.00000 | 17.2859 | 18640018 | -0.00281245 | 0.504763 | 17.2742 |
| 1 | 18640016 | 0.499679 | 0.00227198 | 18.0476 | 18640015 | -0.000217501 | 0.502168 | 17.9423 |
| 2 | 18640017 | 0.499402 | 0.00254899 | 17.3342 | 18640014 | 0.00107756 | 0.500873 | 17.4706 |
| 3 | 18640012 | 0.501207 | 0.000743985 | 17.1922 | 18640011 | 0.00000 | 0.501951 | 17.0622 |