| Red | Green | Blue | |
| z | 17.64 | ||
| znorm | Inf | ||
| sky | -NaN | -Inf | -Inf |
| S/N | 24.5 | 43.2 | 50.7 |
| S/N(c) | 0.0 | 0.0 | 0.0 |
| SN(E/C) |
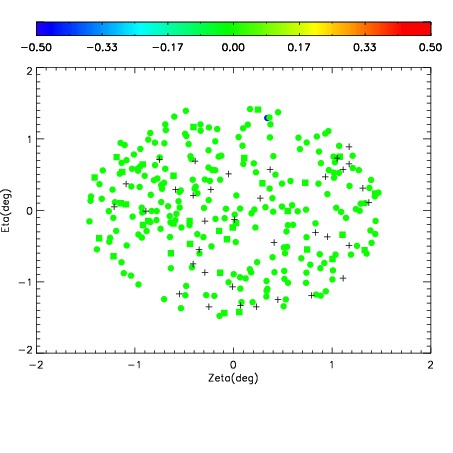
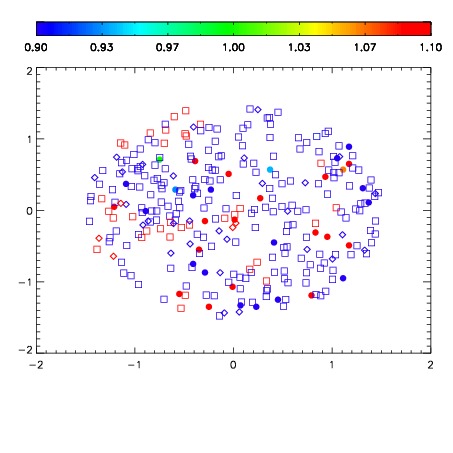
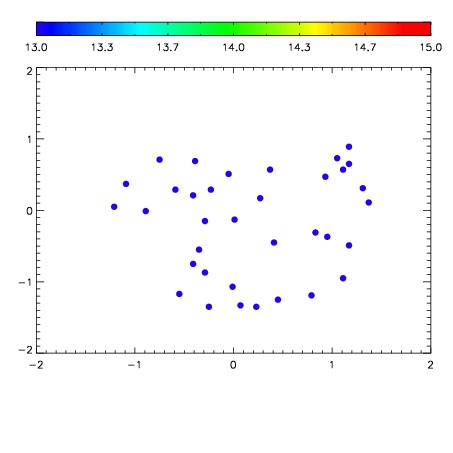

| Frame | Nreads | Zeropoints | Mag plots | Spatial mag deviation | Spatial sky 16325A emission deviations (filled: sky, open: star) | Spatial sky continuum emission | Spatial sky telluric CO2 absorption deviations (filled: H < 10) | |||||||||||||||||||||||
| 0 | 0 |
|
|
|
|
|
|
| IPAIR | NAME | SHIFT | NEWSHIFT | S/N | NAME | SHIFT | NEWSHIFT | S/N |
| 0 | 17700021 | 0.510480 | 0.00000 | 18.3360 | 17700015 | 0.00285777 | 0.507622 | 18.2595 |
| 1 | 17700012 | 0.507317 | 0.00316298 | 18.5683 | 17700019 | 0.00440339 | 0.506077 | 18.7235 |
| 2 | 17700020 | 0.508525 | 0.00195497 | 18.5100 | 17700011 | 0.00000 | 0.510480 | 18.6244 |
| 3 | 17700017 | 0.506666 | 0.00381398 | 18.3174 | 17700018 | 0.00476130 | 0.505719 | 18.1963 |
| 4 | 17700016 | 0.506979 | 0.00350100 | 18.2184 | 17700022 | 0.00500114 | 0.505479 | 18.1521 |
| 5 | 17700013 | 0.507872 | 0.00260800 | 18.1259 | 17700014 | 0.00326308 | 0.507217 | 18.1431 |
| 6 | 17700024 | 0.510141 | 0.000338972 | 17.4527 | 17700023 | 0.00569188 | 0.504788 | 17.7593 |