| Red | Green | Blue | |
| z | 17.64 | ||
| znorm | Inf | ||
| sky | -Inf | -Inf | -NaN |
| S/N | 32.0 | 49.1 | 60.5 |
| S/N(c) | 8.7 | 50.1 | 44.4 |
| SN(E/C) |
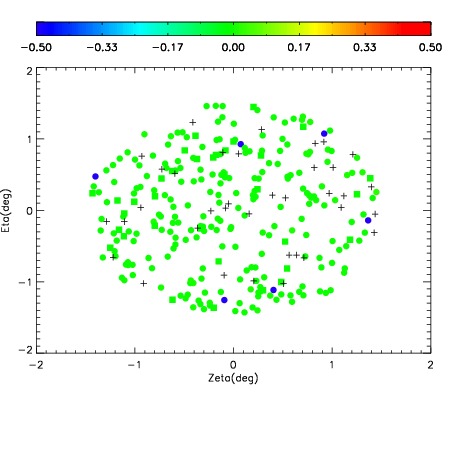
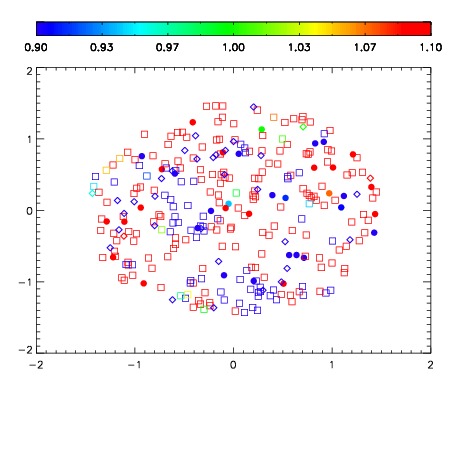


| Frame | Nreads | Zeropoints | Mag plots | Spatial mag deviation | Spatial sky 16325A emission deviations (filled: sky, open: star) | Spatial sky continuum emission | Spatial sky telluric CO2 absorption deviations (filled: H < 10) | |||||||||||||||||||||||
| 0 | 0 |
|
|
|
|
|
|
| IPAIR | NAME | SHIFT | NEWSHIFT | S/N | NAME | SHIFT | NEWSHIFT | S/N |
| 0 | 14650102 | 0.496072 | 0.00000 | 18.9978 | 14650096 | 0.00000 | 0.496072 | 18.9520 |
| 1 | 14650098 | 0.494083 | 0.00198901 | 19.0207 | 14650103 | 0.00292717 | 0.493145 | 19.0325 |
| 2 | 14650097 | 0.493671 | 0.00240099 | 19.0094 | 14650099 | 0.00191708 | 0.494155 | 18.9879 |
| 3 | 14650101 | 0.495684 | 0.000387996 | 19.0022 | 14650100 | 0.00136852 | 0.494703 | 18.9731 |