| Red | Green | Blue | |
| z | 17.64 | ||
| znorm | Inf | ||
| sky | -Inf | -NaN | -Inf |
| S/N | 25.7 | 38.5 | 48.3 |
| S/N(c) | 6.7 | 33.7 | 36.0 |
| SN(E/C) |


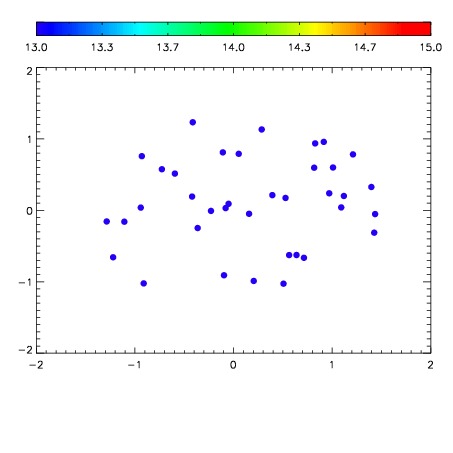

| Frame | Nreads | Zeropoints | Mag plots | Spatial mag deviation | Spatial sky 16325A emission deviations (filled: sky, open: star) | Spatial sky continuum emission | Spatial sky telluric CO2 absorption deviations (filled: H < 10) | |||||||||||||||||||||||
| 0 | 0 |
|
|
|
|
|
|
| IPAIR | NAME | SHIFT | NEWSHIFT | S/N | NAME | SHIFT | NEWSHIFT | S/N |
| 0 | 14750017 | 0.497626 | 0.00000 | 18.7896 | 14750015 | -0.00139832 | 0.499024 | 18.7377 |
| 1 | 14750016 | 0.497572 | 5.40018e-05 | 18.7649 | 14750018 | 0.000506782 | 0.497119 | 18.6731 |
| 2 | 14750013 | 0.496600 | 0.00102600 | 18.5062 | 14750014 | -0.00149373 | 0.499120 | 18.6286 |
| 3 | 14750012 | 0.496197 | 0.00142902 | 18.3554 | 14750011 | 0.00000 | 0.497626 | 18.4412 |