| Red | Green | Blue | |
| z | 17.64 | ||
| znorm | Inf | ||
| sky | -Inf | -Inf | -NaN |
| S/N | 26.0 | 41.2 | 48.6 |
| S/N(c) | 21.5 | 10.1 | 50.2 |
| SN(E/C) |
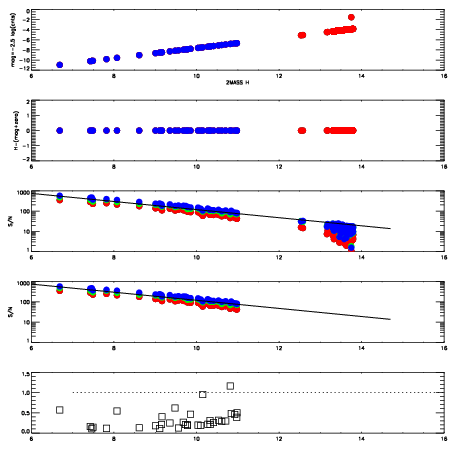


| Frame | Nreads | Zeropoints | Mag plots | Spatial mag deviation | Spatial sky 16325A emission deviations (filled: sky, open: star) | Spatial sky continuum emission | Spatial sky telluric CO2 absorption deviations (filled: H < 10) | |||||||||||||||||||||||
| 0 | 0 |
|
|
|
|
|
|
| IPAIR | NAME | SHIFT | NEWSHIFT | S/N | NAME | SHIFT | NEWSHIFT | S/N |
| 0 | 14940072 | 0.499550 | 0.00000 | 18.7833 | 14940075 | -0.000370318 | 0.499920 | 18.7087 |
| 1 | 14940077 | 0.499263 | 0.000287026 | 18.7931 | 14940071 | 0.00000 | 0.499550 | 18.7745 |
| 2 | 14940076 | 0.498959 | 0.000591010 | 18.7689 | 14940074 | -0.000599682 | 0.500150 | 18.7074 |
| 3 | 14940073 | 0.498656 | 0.000894010 | 18.7032 | 14940078 | -0.000996602 | 0.500547 | 18.6449 |