| Red | Green | Blue | |
| z | 17.64 | ||
| znorm | Inf | ||
| sky | -NaN | -NaN | -NaN |
| S/N | 35.4 | 55.7 | 67.2 |
| S/N(c) | 33.8 | 54.7 | 48.5 |
| SN(E/C) |
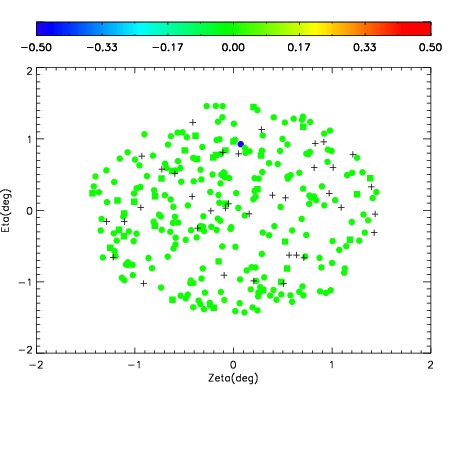

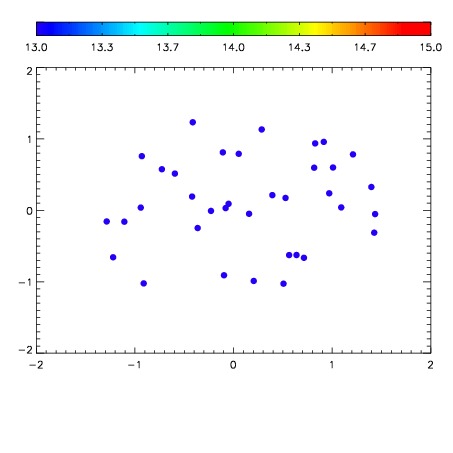

| Frame | Nreads | Zeropoints | Mag plots | Spatial mag deviation | Spatial sky 16325A emission deviations (filled: sky, open: star) | Spatial sky continuum emission | Spatial sky telluric CO2 absorption deviations (filled: H < 10) | |||||||||||||||||||||||
| 0 | 0 |
|
|
|
|
|
|
| IPAIR | NAME | SHIFT | NEWSHIFT | S/N | NAME | SHIFT | NEWSHIFT | S/N |
| 0 | 14970075 | 0.499057 | 0.00000 | 19.1254 | 14970077 | -0.000501541 | 0.499559 | 19.1166 |
| 1 | 14970074 | 0.499054 | 2.98023e-06 | 19.1002 | 14970069 | 0.00000 | 0.499057 | 19.0962 |
| 2 | 14970078 | 0.498672 | 0.000384986 | 19.0853 | 14970076 | -0.000508701 | 0.499566 | 19.0791 |
| 3 | 14970070 | 0.498253 | 0.000804007 | 19.0493 | 14970073 | -0.000797635 | 0.499855 | 19.0193 |
| 4 | 14970071 | 0.498896 | 0.000160992 | 19.0228 | 14970072 | -0.000175996 | 0.499233 | 18.9107 |