| Red | Green | Blue | |
| z | 17.64 | ||
| znorm | Inf | ||
| sky | -NaN | -Inf | -NaN |
| S/N | 31.7 | 51.2 | 56.9 |
| S/N(c) | 31.5 | 52.4 | 44.3 |
| SN(E/C) |


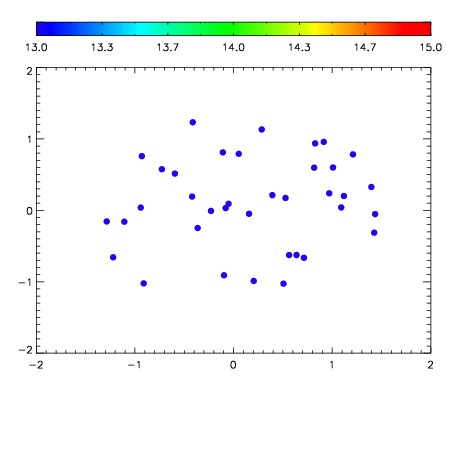

| Frame | Nreads | Zeropoints | Mag plots | Spatial mag deviation | Spatial sky 16325A emission deviations (filled: sky, open: star) | Spatial sky continuum emission | Spatial sky telluric CO2 absorption deviations (filled: H < 10) | |||||||||||||||||||||||
| 0 | 0 |
|
|
|
|
|
|
| IPAIR | NAME | SHIFT | NEWSHIFT | S/N | NAME | SHIFT | NEWSHIFT | S/N |
| 0 | 15000035 | 0.498186 | 0.00000 | 19.1113 | 15000036 | 0.000973736 | 0.497212 | 19.0842 |
| 1 | 15000034 | 0.496899 | 0.00128698 | 19.0423 | 15000037 | 0.00155446 | 0.496632 | 19.0711 |
| 2 | 15000039 | 0.497594 | 0.000591993 | 19.0323 | 15000033 | 0.00000 | 0.498186 | 19.0223 |
| 3 | 15000038 | 0.497086 | 0.00110000 | 19.0053 | 15000040 | 0.00156629 | 0.496620 | 18.9982 |