| Red | Green | Blue | |
| z | 17.64 | ||
| znorm | Inf | ||
| sky | -Inf | -Inf | -NaN |
| S/N | 26.9 | 43.7 | 50.1 |
| S/N(c) | 26.2 | 30.9 | 49.0 |
| SN(E/C) |
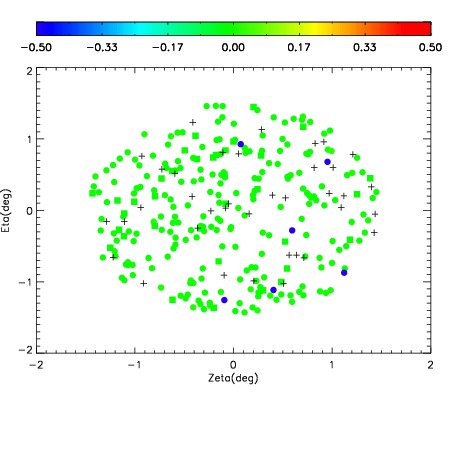


| Frame | Nreads | Zeropoints | Mag plots | Spatial mag deviation | Spatial sky 16325A emission deviations (filled: sky, open: star) | Spatial sky continuum emission | Spatial sky telluric CO2 absorption deviations (filled: H < 10) | |||||||||||||||||||||||
| 0 | 0 |
|
|
|
|
|
|
| IPAIR | NAME | SHIFT | NEWSHIFT | S/N | NAME | SHIFT | NEWSHIFT | S/N |
| 0 | 15040013 | 0.498584 | 0.00000 | 18.8816 | 15040014 | 0.000394816 | 0.498189 | 18.9157 |
| 1 | 15040016 | 0.497680 | 0.000903994 | 19.0252 | 15040015 | 0.000223059 | 0.498361 | 19.0298 |
| 2 | 15040012 | 0.497849 | 0.000735015 | 18.9695 | 15040011 | 0.00000 | 0.498584 | 19.0152 |