| Red | Green | Blue | |
| z | 17.64 | ||
| znorm | Inf | ||
| sky | -NaN | -Inf | -NaN |
| S/N | 25.9 | 43.1 | 48.2 |
| S/N(c) | 28.5 | 31.3 | 49.7 |
| SN(E/C) |
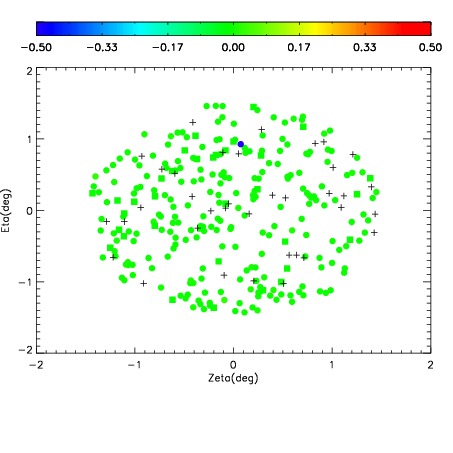
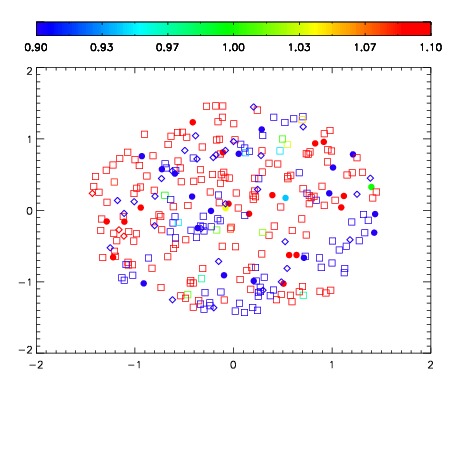
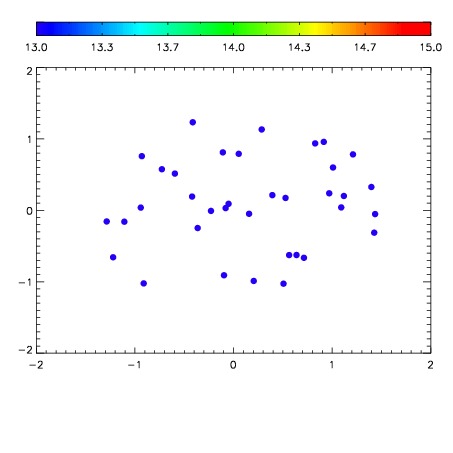

| Frame | Nreads | Zeropoints | Mag plots | Spatial mag deviation | Spatial sky 16325A emission deviations (filled: sky, open: star) | Spatial sky continuum emission | Spatial sky telluric CO2 absorption deviations (filled: H < 10) | |||||||||||||||||||||||
| 0 | 0 |
|
|
|
|
|
|
| IPAIR | NAME | SHIFT | NEWSHIFT | S/N | NAME | SHIFT | NEWSHIFT | S/N |
| 0 | 15250061 | 0.509666 | 0.00000 | 18.7479 | 15250063 | -0.000238921 | 0.509905 | 18.7338 |
| 1 | 15250060 | 0.508572 | 0.00109404 | 18.7793 | 15250059 | 0.00000 | 0.509666 | 18.8269 |
| 2 | 15250064 | 0.508187 | 0.00147903 | 18.7601 | 15250062 | 4.68548e-06 | 0.509661 | 18.7825 |
| 3 | 15250065 | 0.509130 | 0.000536025 | 18.7412 | 15250066 | 0.000315837 | 0.509350 | 18.5293 |