| Red | Green | Blue | |
| z | 17.64 | ||
| znorm | Inf | ||
| sky | -NaN | -Inf | -Inf |
| S/N | 27.6 | 44.5 | 50.0 |
| S/N(c) | 30.0 | 31.9 | 52.7 |
| SN(E/C) |

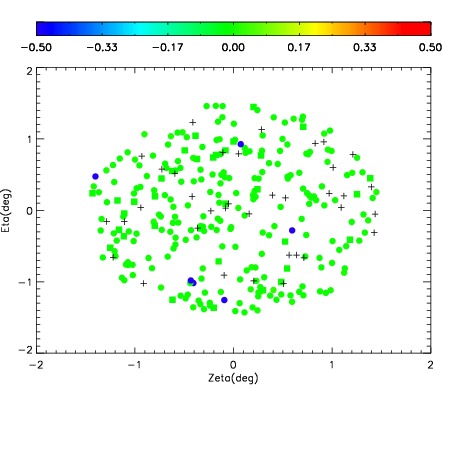

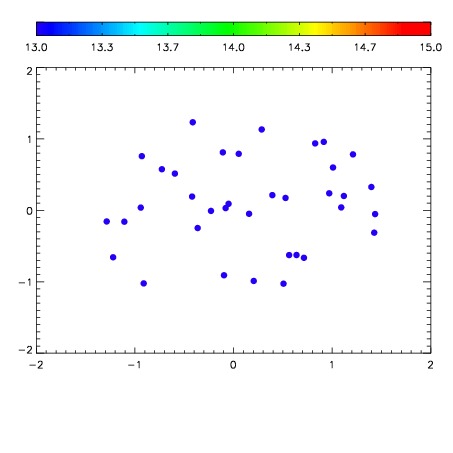

| Frame | Nreads | Zeropoints | Mag plots | Spatial mag deviation | Spatial sky 16325A emission deviations (filled: sky, open: star) | Spatial sky continuum emission | Spatial sky telluric CO2 absorption deviations (filled: H < 10) | |||||||||||||||||||||||
| 0 | 0 |
|
|
|
|
|
|
| IPAIR | NAME | SHIFT | NEWSHIFT | S/N | NAME | SHIFT | NEWSHIFT | S/N |
| 0 | 15260064 | 0.505480 | 0.00000 | 18.9835 | 15260059 | 0.00000 | 0.505480 | 18.8295 |
| 1 | 15260060 | 0.504687 | 0.000792980 | 19.0311 | 15260063 | -0.000545892 | 0.506026 | 19.0928 |
| 2 | 15260061 | 0.505037 | 0.000442982 | 18.9917 | 15260062 | -0.000169488 | 0.505650 | 19.0485 |
| 3 | 15260065 | 0.505176 | 0.000303984 | 18.6957 | 15260066 | -0.000341926 | 0.505822 | 18.0630 |