| Red | Green | Blue | |
| z | 17.64 | ||
| znorm | Inf | ||
| sky | -NaN | -Inf | -NaN |
| S/N | 30.7 | 48.4 | 57.2 |
| S/N(c) | 11.8 | 13.1 | 42.8 |
| SN(E/C) |
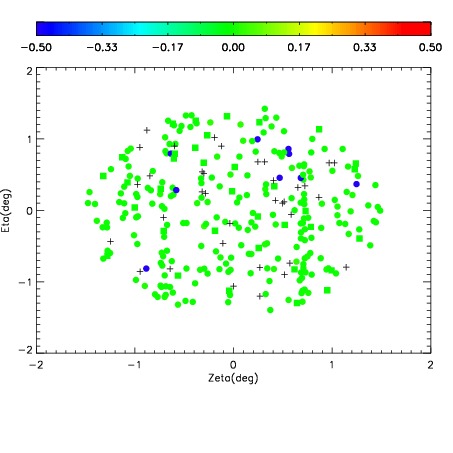
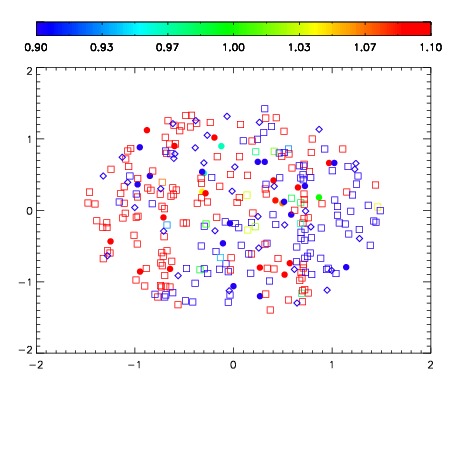
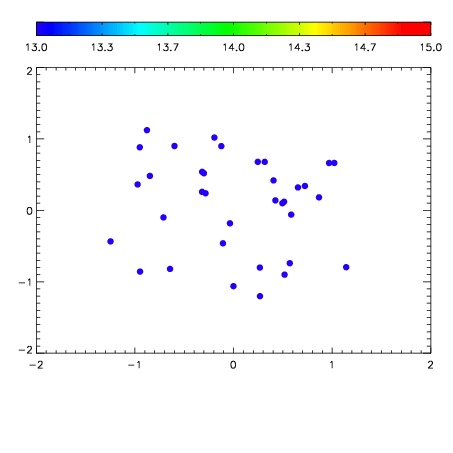

| Frame | Nreads | Zeropoints | Mag plots | Spatial mag deviation | Spatial sky 16325A emission deviations (filled: sky, open: star) | Spatial sky continuum emission | Spatial sky telluric CO2 absorption deviations (filled: H < 10) | |||||||||||||||||||||||
| 0 | 0 |
|
|
|
|
|
|
| IPAIR | NAME | SHIFT | NEWSHIFT | S/N | NAME | SHIFT | NEWSHIFT | S/N |
| 0 | 17960046 | 0.506777 | 0.00000 | 18.8291 | 17960051 | 0.00548697 | 0.501290 | 18.8367 |
| 1 | 17960049 | 0.506656 | 0.000120997 | 18.9119 | 17960048 | 0.00339371 | 0.503383 | 18.9459 |
| 2 | 17960050 | 0.506636 | 0.000140965 | 18.9083 | 17960047 | 0.00362196 | 0.503155 | 18.8548 |
| 3 | 17960045 | 0.506199 | 0.000577986 | 18.8482 | 17960044 | 0.00000 | 0.506777 | 18.8449 |