| Red | Green | Blue | |
| z | 17.64 | ||
| znorm | Inf | ||
| sky | -Inf | -NaN | -NaN |
| S/N | 40.6 | 61.3 | 76.4 |
| S/N(c) | 15.4 | 16.7 | 54.6 |
| SN(E/C) |
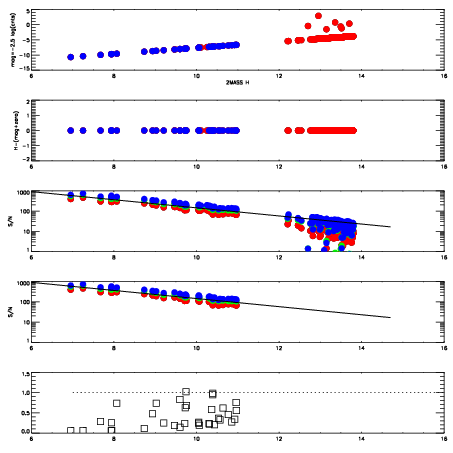
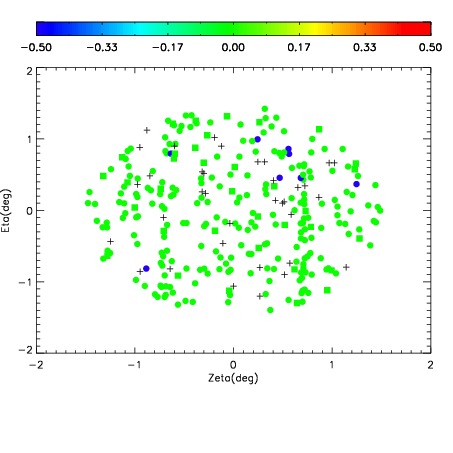
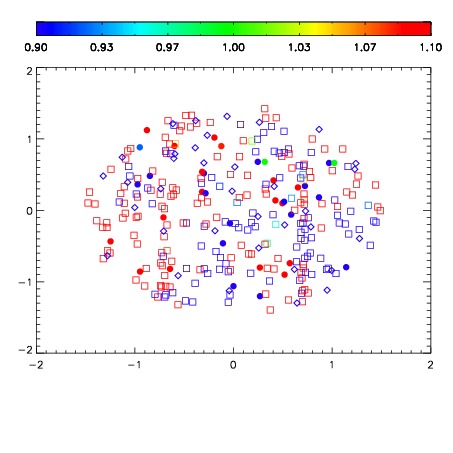
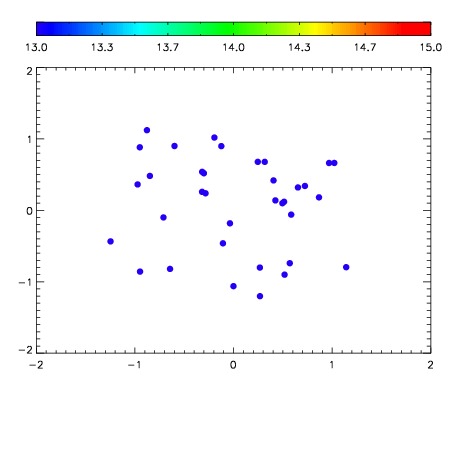

| Frame | Nreads | Zeropoints | Mag plots | Spatial mag deviation | Spatial sky 16325A emission deviations (filled: sky, open: star) | Spatial sky continuum emission | Spatial sky telluric CO2 absorption deviations (filled: H < 10) | |||||||||||||||||||||||
| 0 | 0 |
|
|
|
|
|
|
| IPAIR | NAME | SHIFT | NEWSHIFT | S/N | NAME | SHIFT | NEWSHIFT | S/N |
| 0 | 17990021 | 0.499606 | 0.00000 | 18.9840 | 17990022 | 0.00456622 | 0.495040 | 19.0095 |
| 1 | 17990020 | 0.499133 | 0.000473022 | 19.0120 | 17990019 | 0.00235817 | 0.497248 | 19.0128 |
| 2 | 17990017 | 0.498144 | 0.00146201 | 18.9419 | 17990018 | 0.00286537 | 0.496741 | 19.0066 |
| 3 | 17990016 | 0.497349 | 0.00225702 | 18.9101 | 17990015 | -0.00102034 | 0.500626 | 18.8588 |
| 4 | 17990012 | 0.498543 | 0.00106302 | 18.8154 | 17990011 | 0.00000 | 0.499606 | 18.7989 |
| 5 | 17990013 | 0.497945 | 0.00166100 | 18.7514 | 17990014 | -0.00174125 | 0.501347 | 18.7749 |