| Red | Green | Blue | |
| z | 17.64 | ||
| znorm | Inf | ||
| sky | -NaN | -Inf | -NaN |
| S/N | 31.6 | 47.7 | 58.3 |
| S/N(c) | 11.3 | 12.4 | 41.4 |
| SN(E/C) |

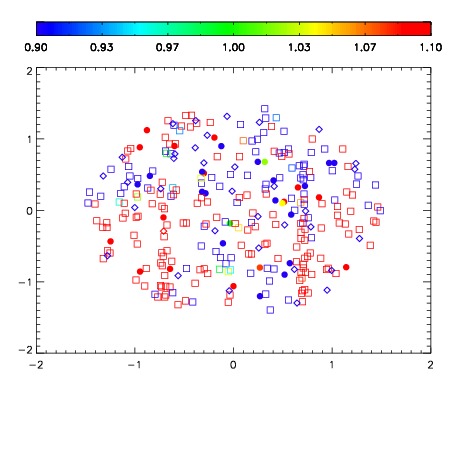
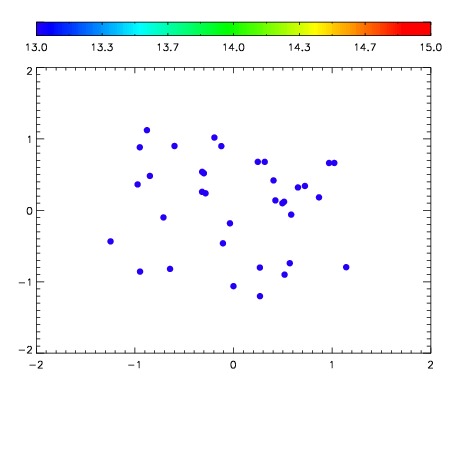

| Frame | Nreads | Zeropoints | Mag plots | Spatial mag deviation | Spatial sky 16325A emission deviations (filled: sky, open: star) | Spatial sky continuum emission | Spatial sky telluric CO2 absorption deviations (filled: H < 10) | |||||||||||||||||||||||
| 0 | 0 |
|
|
|
|
|
|
| IPAIR | NAME | SHIFT | NEWSHIFT | S/N | NAME | SHIFT | NEWSHIFT | S/N |
| 0 | 18520017 | 0.495299 | 0.00000 | 18.6469 | 18520018 | 0.00252426 | 0.492775 | 18.7162 |
| 1 | 18520016 | 0.494318 | 0.000981003 | 18.6955 | 18520015 | 0.00147743 | 0.493822 | 18.7253 |
| 2 | 18520012 | 0.492698 | 0.00260100 | 18.6449 | 18520014 | 0.00110640 | 0.494193 | 18.6954 |
| 3 | 18520013 | 0.493621 | 0.00167802 | 18.6399 | 18520011 | 0.00000 | 0.495299 | 18.6904 |