| Red | Green | Blue | |
| z | 17.64 | ||
| znorm | Inf | ||
| sky | -Inf | -NaN | -NaN |
| S/N | 36.5 | 57.2 | 65.7 |
| S/N(c) | 13.6 | 35.2 | 72.7 |
| SN(E/C) |
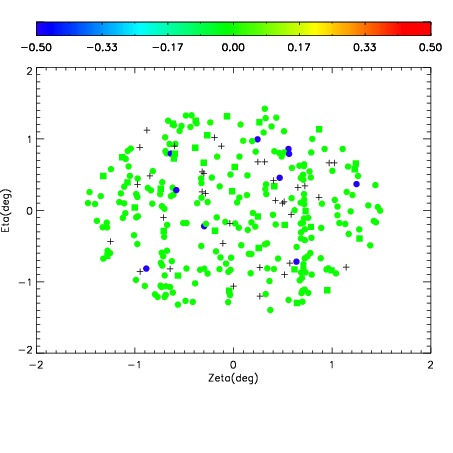
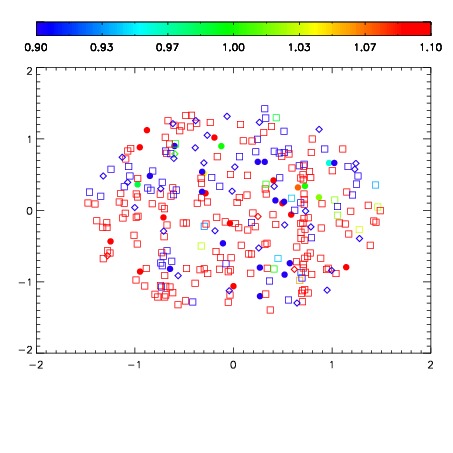
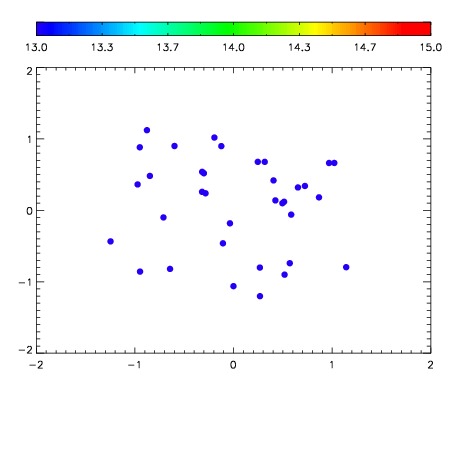

| Frame | Nreads | Zeropoints | Mag plots | Spatial mag deviation | Spatial sky 16325A emission deviations (filled: sky, open: star) | Spatial sky continuum emission | Spatial sky telluric CO2 absorption deviations (filled: H < 10) | |||||||||||||||||||||||
| 0 | 0 |
|
|
|
|
|
|
| IPAIR | NAME | SHIFT | NEWSHIFT | S/N | NAME | SHIFT | NEWSHIFT | S/N |
| 0 | 18740039 | 0.00114358 | 0.00000 | 19.0928 | 18740040 | -0.499133 | 0.500277 | 19.0900 |
| 1 | 18740042 | 0.000603832 | 0.000539748 | 19.0852 | 18740041 | -0.499208 | 0.500352 | 19.0716 |
| 2 | 18740038 | 0.000450851 | 0.000692729 | 19.0765 | 18740037 | -0.498314 | 0.499458 | 19.0585 |
| 3 | 18740035 | 0.00000 | 0.00114358 | 19.0364 | 18740036 | -0.498554 | 0.499698 | 19.0162 |