| Red | Green | Blue | |
| z | 17.64 | ||
| znorm | Inf | ||
| sky | -NaN | -Inf | -NaN |
| S/N | 39.2 | 61.7 | 72.6 |
| S/N(c) | 27.0 | 45.1 | 19.7 |
| SN(E/C) |
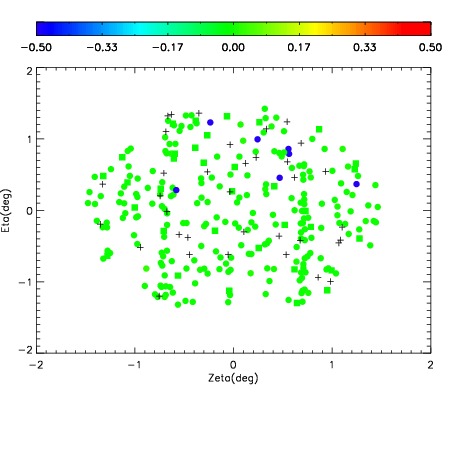
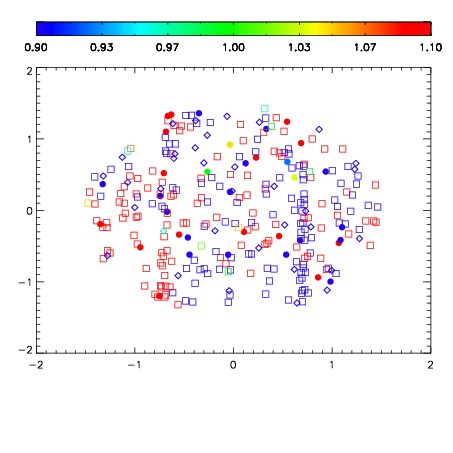
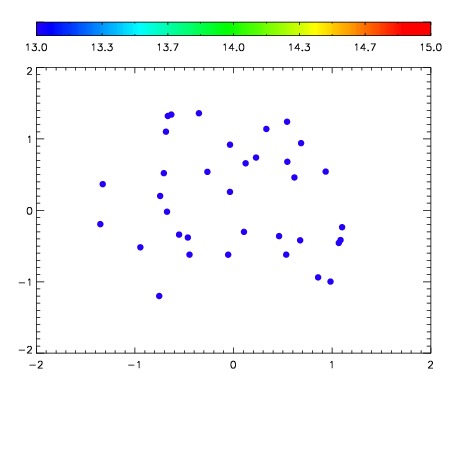

| Frame | Nreads | Zeropoints | Mag plots | Spatial mag deviation | Spatial sky 16325A emission deviations (filled: sky, open: star) | Spatial sky continuum emission | Spatial sky telluric CO2 absorption deviations (filled: H < 10) | |||||||||||||||||||||||
| 0 | 0 |
|
|
|
|
|
|
| IPAIR | NAME | SHIFT | NEWSHIFT | S/N | NAME | SHIFT | NEWSHIFT | S/N |
| 0 | 17980036 | 0.508489 | 0.00000 | 19.0804 | 17980034 | 0.00390568 | 0.504583 | 19.0884 |
| 1 | 17980035 | 0.508322 | 0.000167012 | 19.0697 | 17980037 | 0.00997623 | 0.498513 | 19.0327 |
| 2 | 17980031 | 0.507095 | 0.00139403 | 18.9874 | 17980033 | 0.00407606 | 0.504413 | 18.9920 |
| 3 | 17980032 | 0.507706 | 0.000783026 | 18.9385 | 17980030 | 0.000768303 | 0.507721 | 18.8968 |
| 4 | 17980027 | 0.506158 | 0.00233102 | 18.8576 | 17980026 | 0.00000 | 0.508489 | 18.8653 |
| 5 | 17980028 | 0.506583 | 0.00190604 | 18.8315 | 17980029 | 0.000795208 | 0.507694 | 18.8403 |