| Red | Green | Blue | |
| z | 17.70 | ||
| znorm | Inf | ||
| sky | -NaN | -Inf | -Inf |
| S/N | 26.9 | 42.6 | 53.0 |
| S/N(c) | 13.0 | 14.0 | 46.4 |
| SN(E/C) |
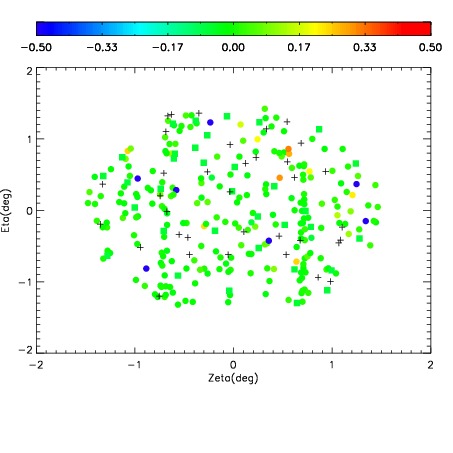
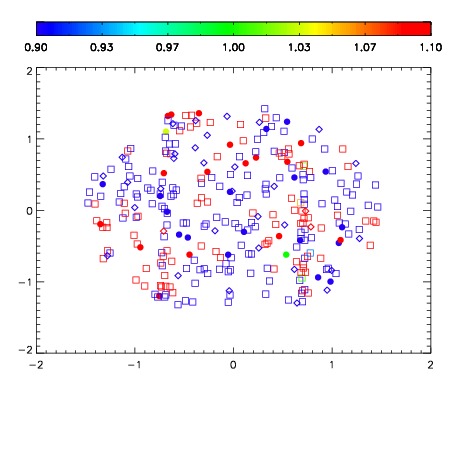


| Frame | Nreads | Zeropoints | Mag plots | Spatial mag deviation | Spatial sky 16325A emission deviations (filled: sky, open: star) | Spatial sky continuum emission | Spatial sky telluric CO2 absorption deviations (filled: H < 10) | |||||||||||||||||||||||
| 0 | 0 |
|
|
|
|
|
|
| IPAIR | NAME | SHIFT | NEWSHIFT | S/N | NAME | SHIFT | NEWSHIFT | S/N |
| 0 | 18490052 | 0.503168 | 0.00000 | 17.7118 | 18490062 | 0.000248350 | 0.502920 | 18.3005 |
| 1 | 18490060 | 0.500983 | 0.00218499 | 18.8874 | 18490061 | -0.000152305 | 0.503320 | 18.8138 |
| 2 | 18490059 | 0.500780 | 0.00238800 | 18.5960 | 18490058 | -0.000332862 | 0.503501 | 18.6679 |
| 3 | 18490056 | 0.501772 | 0.00139600 | 18.4998 | 18490057 | -0.000378779 | 0.503547 | 18.6570 |
| 4 | 18490055 | 0.501831 | 0.00133699 | 18.3077 | 18490053 | -0.000441916 | 0.503610 | 18.4338 |
| 5 | 18490047 | 0.502135 | 0.00103301 | 18.2642 | 18490054 | -0.000591193 | 0.503759 | 18.3412 |
| 6 | 18490048 | 0.502460 | 0.000707984 | 18.2147 | 18490046 | 0.00000 | 0.503168 | 18.3372 |
| 7 | 18490051 | 0.502375 | 0.000792980 | 17.5427 | 18490049 | 0.00138447 | 0.501783 | 17.7249 |
| 8 | 18490063 | 0.501011 | 0.00215697 | 17.1558 | 18490050 | 0.000666597 | 0.502501 | 17.2798 |