| Red | Green | Blue | |
| z | 17.64 | ||
| znorm | Inf | ||
| sky | -Inf | -Inf | -NaN |
| S/N | 27.8 | 43.0 | 50.9 |
| S/N(c) | 18.1 | 30.6 | 13.4 |
| SN(E/C) |
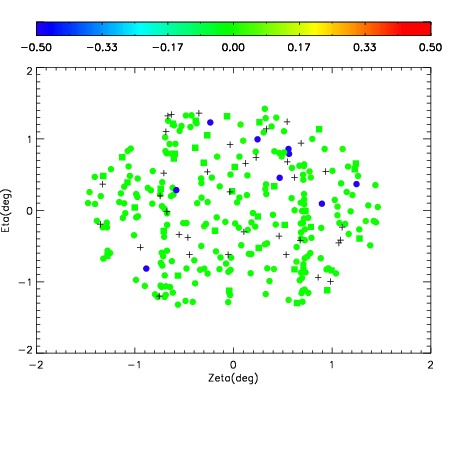
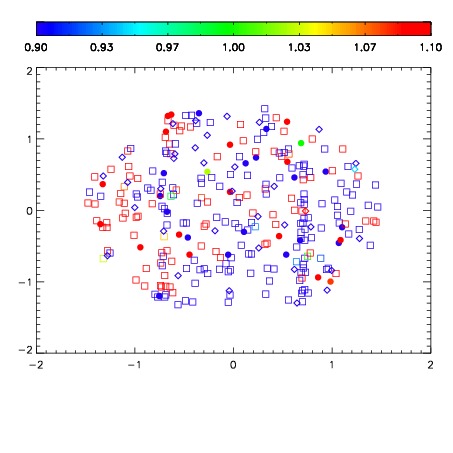
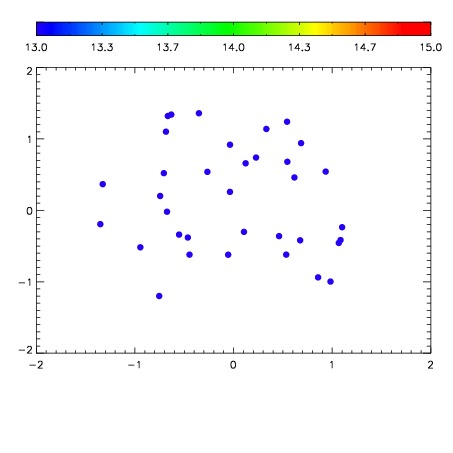

| Frame | Nreads | Zeropoints | Mag plots | Spatial mag deviation | Spatial sky 16325A emission deviations (filled: sky, open: star) | Spatial sky continuum emission | Spatial sky telluric CO2 absorption deviations (filled: H < 10) | |||||||||||||||||||||||
| 0 | 0 |
|
|
|
|
|
|
| IPAIR | NAME | SHIFT | NEWSHIFT | S/N | NAME | SHIFT | NEWSHIFT | S/N |
| 0 | 19090019 | 0.514632 | 0.00000 | 18.4515 | 19090020 | -0.000115149 | 0.514747 | 18.5036 |
| 1 | 19090018 | 0.513447 | 0.00118500 | 18.7234 | 19090017 | -0.000334153 | 0.514966 | 18.7217 |
| 2 | 19090015 | 0.511166 | 0.00346601 | 18.5670 | 19090016 | -0.000326032 | 0.514958 | 18.6879 |
| 3 | 19090014 | 0.510900 | 0.00373197 | 18.5260 | 19090013 | 0.00000 | 0.514632 | 18.5239 |