| Red | Green | Blue | |
| z | 17.64 | ||
| znorm | Inf | ||
| sky | -Inf | -Inf | -Inf |
| S/N | 27.1 | 43.4 | 49.9 |
| S/N(c) | 9.4 | 56.7 | 27.5 |
| SN(E/C) |
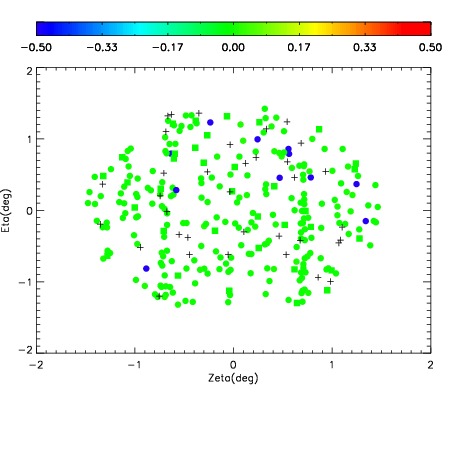
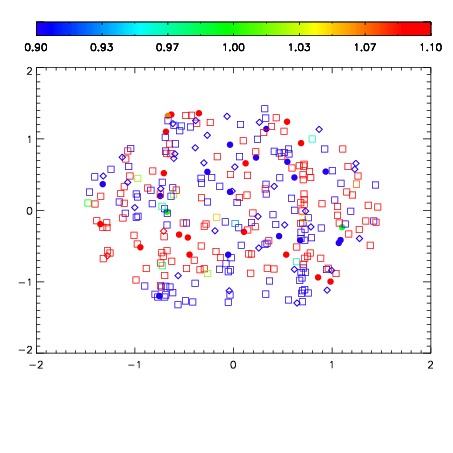
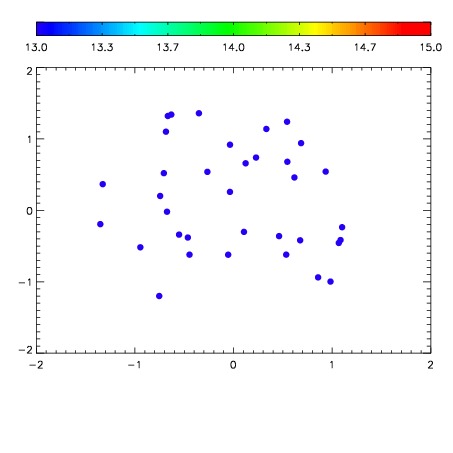

| Frame | Nreads | Zeropoints | Mag plots | Spatial mag deviation | Spatial sky 16325A emission deviations (filled: sky, open: star) | Spatial sky continuum emission | Spatial sky telluric CO2 absorption deviations (filled: H < 10) | |||||||||||||||||||||||
| 0 | 0 |
|
|
|
|
|
|
| IPAIR | NAME | SHIFT | NEWSHIFT | S/N | NAME | SHIFT | NEWSHIFT | S/N |
| 0 | 19120020 | 0.00000 | 0.00000 | 18.8412 | 19120022 | -0.496421 | 0.496421 | 18.8627 |
| 1 | 19120023 | -0.00137140 | 0.00137140 | 18.8208 | 19120021 | -0.496196 | 0.496196 | 18.8141 |
| 2 | 19120024 | -0.00152602 | 0.00152602 | 18.6362 | 19120025 | -0.496063 | 0.496063 | 18.6703 |