| Red | Green | Blue | |
| z | 17.64 | ||
| znorm | Inf | ||
| sky | -Inf | -Inf | -NaN |
| S/N | 18.2 | 31.8 | 35.4 |
| S/N(c) | 0.0 | 0.0 | 0.0 |
| SN(E/C) |
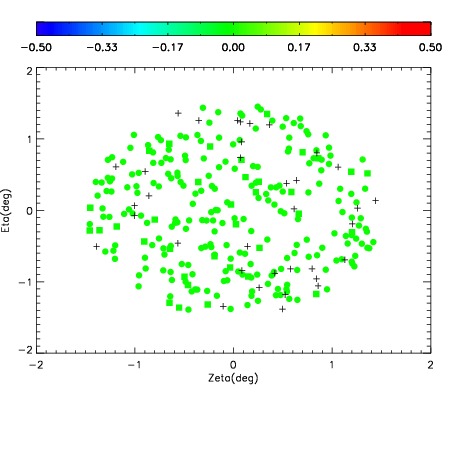
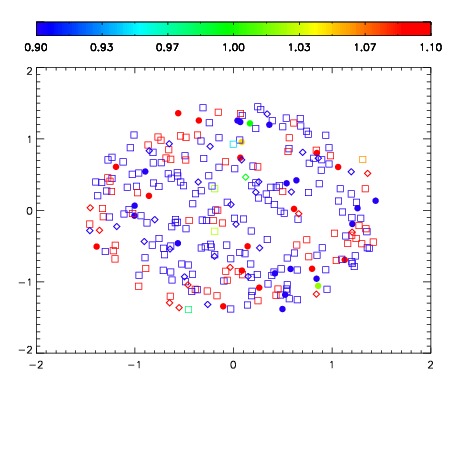
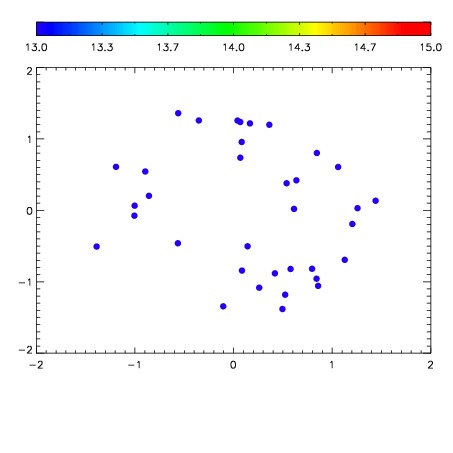

| Frame | Nreads | Zeropoints | Mag plots | Spatial mag deviation | Spatial sky 16325A emission deviations (filled: sky, open: star) | Spatial sky continuum emission | Spatial sky telluric CO2 absorption deviations (filled: H < 10) | |||||||||||||||||||||||
| 0 | 0 |
|
|
|
|
|
|
| IPAIR | NAME | SHIFT | NEWSHIFT | S/N | NAME | SHIFT | NEWSHIFT | S/N |
| 0 | 15210024 | 0.509758 | 0.00000 | 18.7531 | 15210026 | 0.000634320 | 0.509124 | 18.9193 |
| 1 | 15210027 | 0.508582 | 0.00117600 | 18.6071 | 15210025 | 0.00123999 | 0.508518 | 18.7727 |
| 2 | 15210023 | 0.508540 | 0.00121802 | 18.5208 | 15210022 | 0.00000 | 0.509758 | 18.3513 |
| 3 | 15210028 | 0.509621 | 0.000136971 | 18.4707 | 15210029 | 0.00179987 | 0.507958 | 18.1493 |