| Red | Green | Blue | |
| z | 17.64 | ||
| znorm | Inf | ||
| sky | -Inf | -Inf | -NaN |
| S/N | 18.9 | 32.4 | 36.2 |
| S/N(c) | 0.0 | 0.0 | 0.0 |
| SN(E/C) |
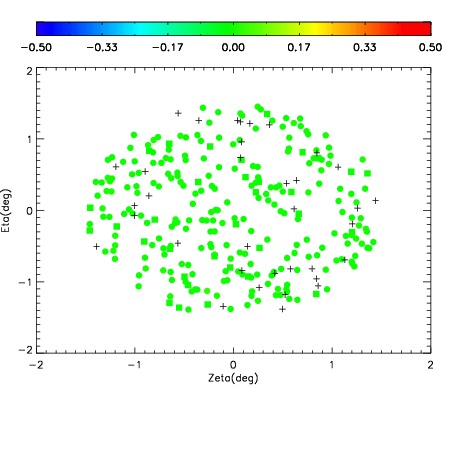
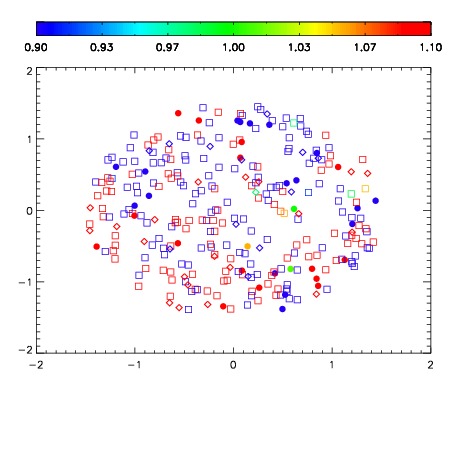
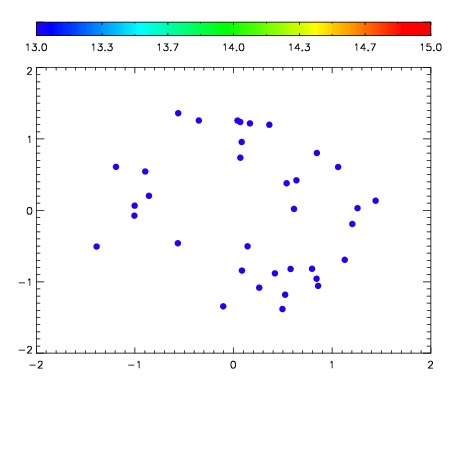

| Frame | Nreads | Zeropoints | Mag plots | Spatial mag deviation | Spatial sky 16325A emission deviations (filled: sky, open: star) | Spatial sky continuum emission | Spatial sky telluric CO2 absorption deviations (filled: H < 10) | |||||||||||||||||||||||
| 0 | 0 |
|
|
|
|
|
|
| IPAIR | NAME | SHIFT | NEWSHIFT | S/N | NAME | SHIFT | NEWSHIFT | S/N |
| 0 | 15520016 | 0.492409 | 0.00000 | 16.4004 | 15520015 | 0.00119922 | 0.491210 | 18.1553 |
| 1 | 15520012 | 0.489738 | 0.00267100 | 19.0897 | 15520011 | 0.00000 | 0.492409 | 19.0544 |
| 2 | 15520017 | 0.491114 | 0.00129500 | 18.5322 | 15520018 | -0.00153340 | 0.493942 | 18.8674 |
| 3 | 15520013 | 0.491212 | 0.00119698 | 18.4886 | 15520014 | 0.00148736 | 0.490922 | 18.3604 |