| Red | Green | Blue | |
| z | 17.64 | ||
| znorm | Inf | ||
| sky | -Inf | -Inf | -Inf |
| S/N | 17.5 | 28.2 | 33.7 |
| S/N(c) | 0.0 | 0.0 | 0.0 |
| SN(E/C) |
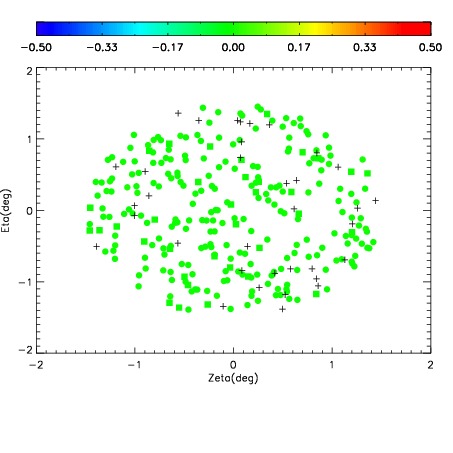
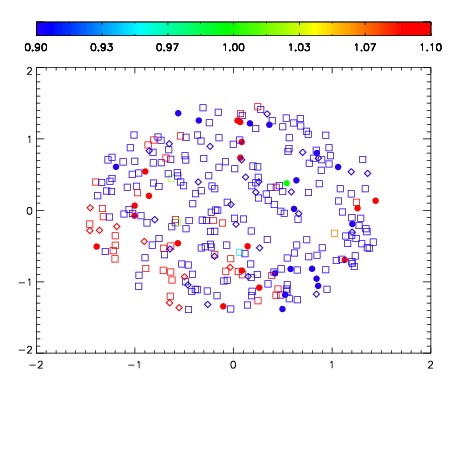
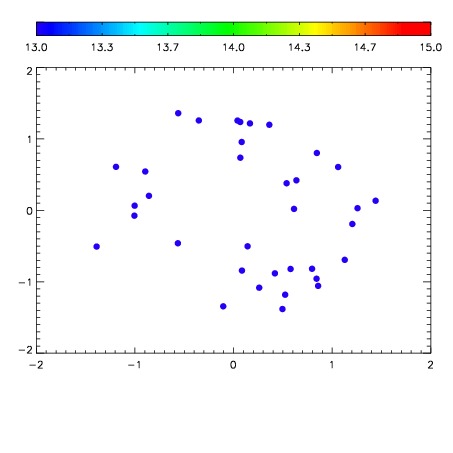

| Frame | Nreads | Zeropoints | Mag plots | Spatial mag deviation | Spatial sky 16325A emission deviations (filled: sky, open: star) | Spatial sky continuum emission | Spatial sky telluric CO2 absorption deviations (filled: H < 10) | |||||||||||||||||||||||
| 0 | 0 |
|
|
|
|
|
|
| IPAIR | NAME | SHIFT | NEWSHIFT | S/N | NAME | SHIFT | NEWSHIFT | S/N |
| 0 | 17620065 | 0.510102 | 0.00000 | 16.8063 | 17620067 | 0.00791251 | 0.502189 | 17.6039 |
| 1 | 17620061 | 0.505173 | 0.00492895 | 19.2137 | 17620060 | 0.00000 | 0.510102 | 19.1971 |
| 2 | 17620062 | 0.506483 | 0.00361896 | 19.0065 | 17620063 | 0.00573850 | 0.504363 | 18.2472 |