| Red | Green | Blue | |
| z | 17.64 | ||
| znorm | Inf | ||
| sky | -Inf | -Inf | -Inf |
| S/N | 30.8 | 51.2 | 61.3 |
| S/N(c) | 0.0 | 0.0 | 0.0 |
| SN(E/C) |
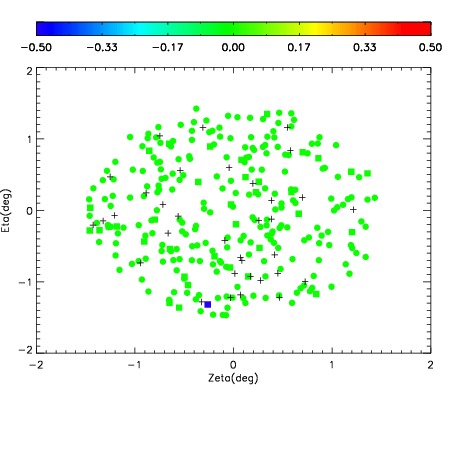
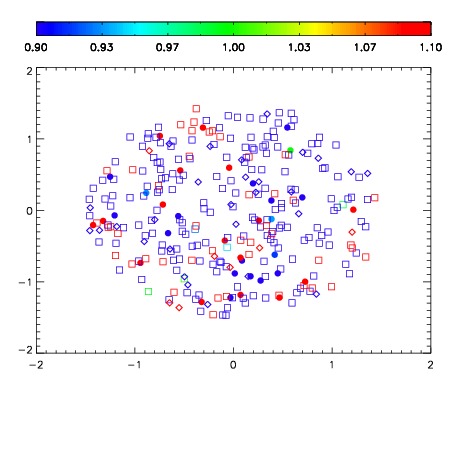
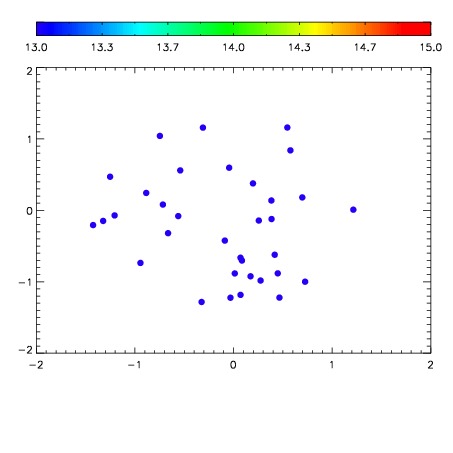

| Frame | Nreads | Zeropoints | Mag plots | Spatial mag deviation | Spatial sky 16325A emission deviations (filled: sky, open: star) | Spatial sky continuum emission | Spatial sky telluric CO2 absorption deviations (filled: H < 10) | |||||||||||||||||||||||
| 0 | 0 |
|
|
|
|
|
|
| IPAIR | NAME | SHIFT | NEWSHIFT | S/N | NAME | SHIFT | NEWSHIFT | S/N |
| 0 | 17670077 | 0.507291 | 0.00000 | 19.2719 | 17670074 | 0.00143500 | 0.505856 | 19.2948 |
| 1 | 17670076 | 0.506129 | 0.00116199 | 19.3002 | 17670075 | 0.00188178 | 0.505409 | 19.3075 |
| 2 | 17670073 | 0.505606 | 0.00168502 | 19.2652 | 17670071 | 0.00000 | 0.507291 | 19.2666 |
| 3 | 17670072 | 0.504630 | 0.00266099 | 19.2464 | 17670078 | 0.00357016 | 0.503721 | 19.2478 |