| Red | Green | Blue | |
| z | 17.64 | ||
| znorm | Inf | ||
| sky | -Inf | -Inf | -NaN |
| S/N | 25.7 | 45.7 | 52.4 |
| S/N(c) | 0.0 | 0.0 | 0.0 |
| SN(E/C) |
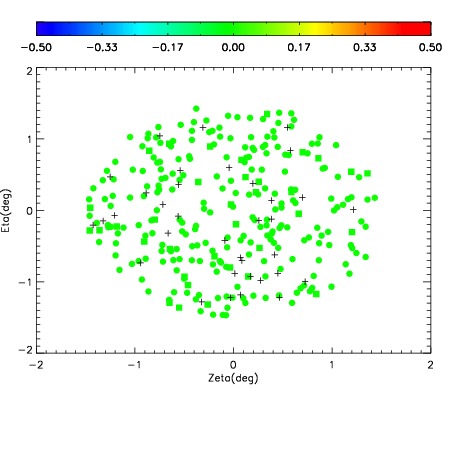
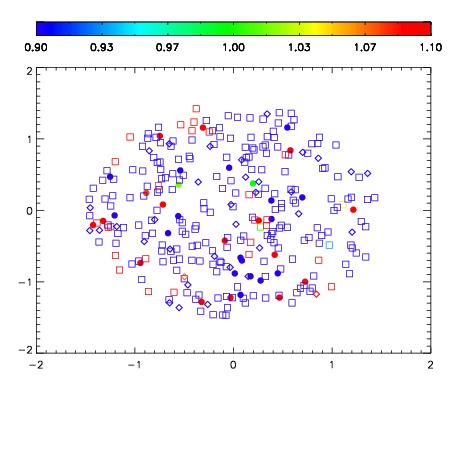
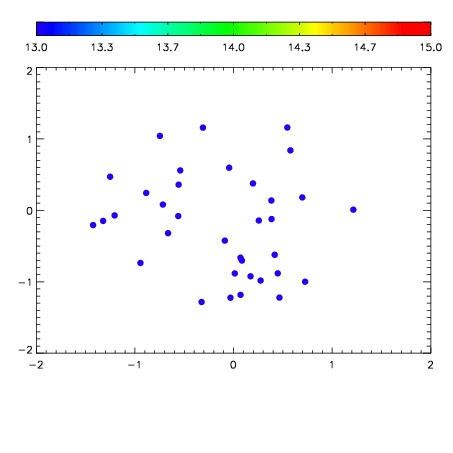

| Frame | Nreads | Zeropoints | Mag plots | Spatial mag deviation | Spatial sky 16325A emission deviations (filled: sky, open: star) | Spatial sky continuum emission | Spatial sky telluric CO2 absorption deviations (filled: H < 10) | |||||||||||||||||||||||
| 0 | 0 |
|
|
|
|
|
|
| IPAIR | NAME | SHIFT | NEWSHIFT | S/N | NAME | SHIFT | NEWSHIFT | S/N |
| 0 | 17940044 | 0.506796 | 0.00000 | 18.7318 | 17940047 | -0.000114032 | 0.506910 | 18.8486 |
| 1 | 17940045 | 0.506733 | 6.30021e-05 | 18.9111 | 17940046 | -0.000261393 | 0.507057 | 18.9252 |
| 2 | 17940048 | 0.504193 | 0.00260299 | 18.8215 | 17940039 | 0.00000 | 0.506796 | 18.9056 |
| 3 | 17940041 | 0.506696 | 0.000100017 | 18.6834 | 17940042 | 0.000576646 | 0.506219 | 18.6170 |
| 4 | 17940040 | 0.506676 | 0.000119984 | 18.6750 | 17940043 | 0.000680573 | 0.506115 | 18.5812 |