| Red | Green | Blue | |
| z | 17.64 | ||
| znorm | Inf | ||
| sky | -Inf | -NaN | -Inf |
| S/N | 23.1 | 42.3 | 49.5 |
| S/N(c) | 0.0 | 0.0 | 0.0 |
| SN(E/C) |
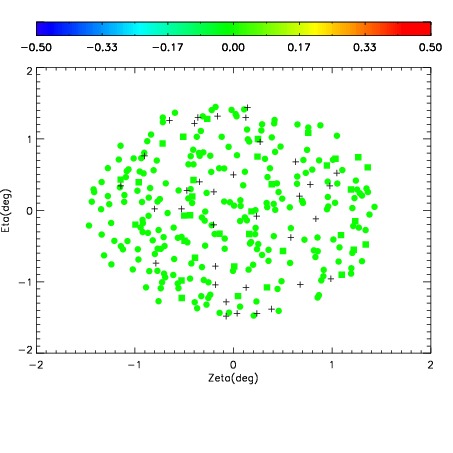
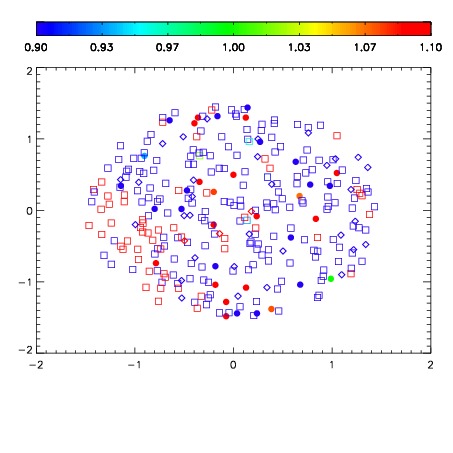
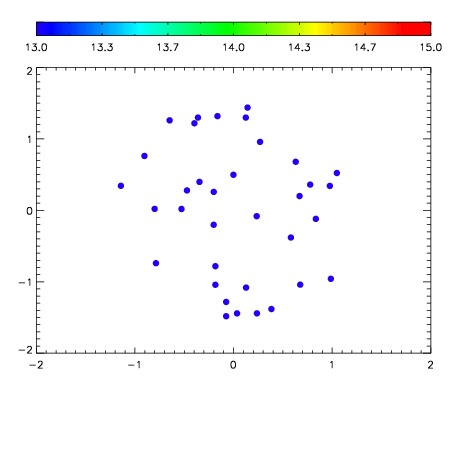

| Frame | Nreads | Zeropoints | Mag plots | Spatial mag deviation | Spatial sky 16325A emission deviations (filled: sky, open: star) | Spatial sky continuum emission | Spatial sky telluric CO2 absorption deviations (filled: H < 10) | |||||||||||||||||||||||
| 0 | 0 |
|
|
|
|
|
|
| IPAIR | NAME | SHIFT | NEWSHIFT | S/N | NAME | SHIFT | NEWSHIFT | S/N |
| 0 | 17990032 | 0.500604 | 0.00000 | 18.4698 | 17990030 | -0.00136781 | 0.501972 | 18.7083 |
| 1 | 17990027 | 0.496991 | 0.00361297 | 18.8677 | 17990026 | 0.00000 | 0.500604 | 19.0349 |
| 2 | 17990028 | 0.497953 | 0.00265098 | 18.7525 | 17990029 | -0.00200490 | 0.502609 | 18.8289 |
| 3 | 17990031 | 0.500091 | 0.000512958 | 18.4102 | 17990033 | 0.000412203 | 0.500192 | 18.3229 |
| 4 | 17990039 | 0.499468 | 0.00113598 | 17.8783 | 17990034 | -0.000509257 | 0.501113 | 18.2484 |
| 5 | 17990035 | 0.498200 | 0.00240397 | 17.8694 | 17990038 | 0.00104636 | 0.499558 | 18.0744 |
| 6 | 17990040 | 0.500181 | 0.000422955 | 17.7283 | 17990037 | 0.000902884 | 0.499701 | 17.6884 |
| 7 | 17990036 | 0.499554 | 0.00104997 | 17.3921 | 17990041 | 0.00136433 | 0.499240 | 17.6246 |