| Red | Green | Blue | |
| z | 17.64 | ||
| znorm | Inf | ||
| sky | -Inf | -Inf | -Inf |
| S/N | 25.8 | 42.8 | 51.9 |
| S/N(c) | 0.0 | 0.0 | 0.0 |
| SN(E/C) |
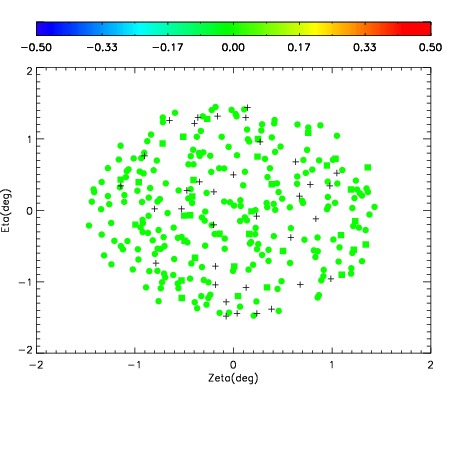
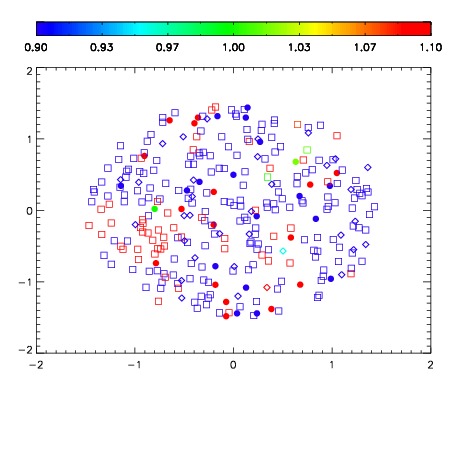
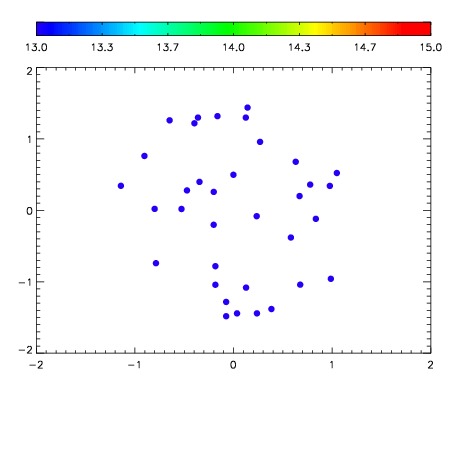

| Frame | Nreads | Zeropoints | Mag plots | Spatial mag deviation | Spatial sky 16325A emission deviations (filled: sky, open: star) | Spatial sky continuum emission | Spatial sky telluric CO2 absorption deviations (filled: H < 10) | |||||||||||||||||||||||
| 0 | 0 |
|
|
|
|
|
|
| IPAIR | NAME | SHIFT | NEWSHIFT | S/N | NAME | SHIFT | NEWSHIFT | S/N |
| 0 | 19050013 | 0.502229 | 0.00000 | 18.9692 | 19050014 | -0.000505677 | 0.502735 | 19.0382 |
| 1 | 19050017 | 0.501495 | 0.000733972 | 19.1035 | 19050018 | 0.00166704 | 0.500562 | 19.1197 |
| 2 | 19050016 | 0.500651 | 0.00157797 | 19.0684 | 19050015 | -0.000495142 | 0.502724 | 19.0518 |
| 3 | 19050012 | 0.502188 | 4.09484e-05 | 18.8390 | 19050011 | 0.00000 | 0.502229 | 18.9008 |