| Red | Green | Blue | |
| z | 17.64 | ||
| znorm | Inf | ||
| sky | -Inf | -Inf | -NaN |
| S/N | 28.9 | 48.4 | 59.6 |
| S/N(c) | 0.0 | 0.0 | 0.0 |
| SN(E/C) |


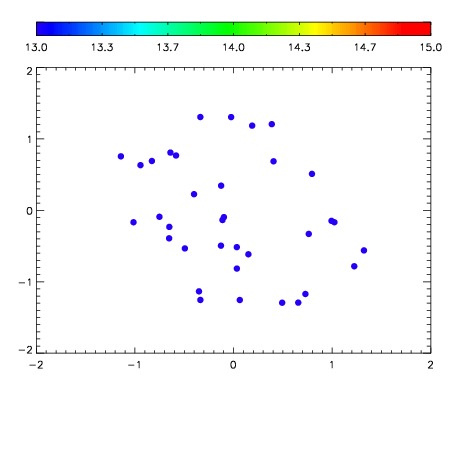

| Frame | Nreads | Zeropoints | Mag plots | Spatial mag deviation | Spatial sky 16325A emission deviations (filled: sky, open: star) | Spatial sky continuum emission | Spatial sky telluric CO2 absorption deviations (filled: H < 10) | |||||||||||||||||||||||
| 0 | 0 |
|
|
|
|
|
|
| IPAIR | NAME | SHIFT | NEWSHIFT | S/N | NAME | SHIFT | NEWSHIFT | S/N |
| 0 | 17070031 | 0.483899 | 0.00000 | 19.1347 | 17070032 | 0.00199267 | 0.481906 | 19.1119 |
| 1 | 17070026 | 0.480863 | 0.00303599 | 19.2339 | 17070029 | 0.000646886 | 0.483252 | 19.2337 |
| 2 | 17070027 | 0.480121 | 0.00377801 | 19.2230 | 17070028 | 0.000552217 | 0.483347 | 19.1750 |
| 3 | 17070030 | 0.482407 | 0.00149199 | 19.2016 | 17070025 | 0.00000 | 0.483899 | 19.1699 |