| Red | Green | Blue | |
| z | 17.64 | ||
| znorm | Inf | ||
| sky | -Inf | -Inf | -NaN |
| S/N | 31.8 | 46.9 | 55.4 |
| S/N(c) | 0.0 | 0.0 | 0.0 |
| SN(E/C) |
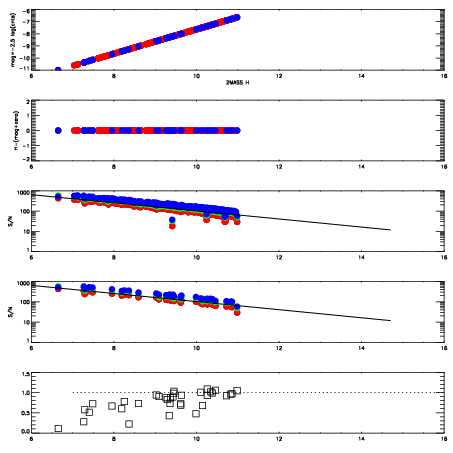
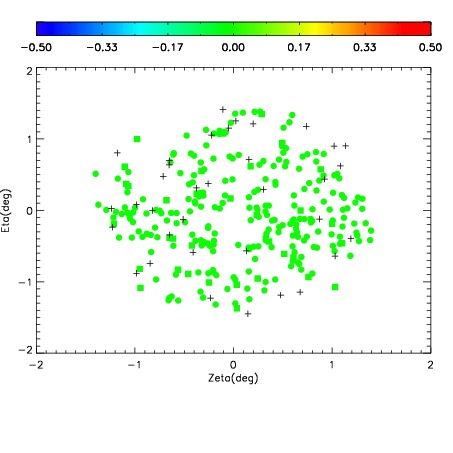
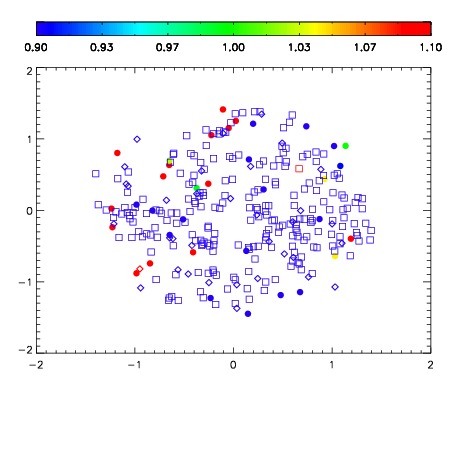
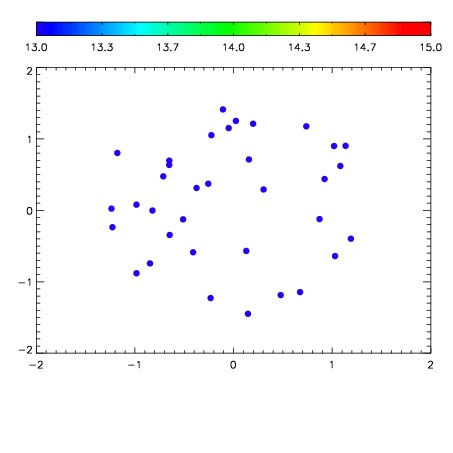

| Frame | Nreads | Zeropoints | Mag plots | Spatial mag deviation | Spatial sky 16325A emission deviations (filled: sky, open: star) | Spatial sky continuum emission | Spatial sky telluric CO2 absorption deviations (filled: H < 10) | |||||||||||||||||||||||
| 0 | 0 |
|
|
|
|
|
|
| IPAIR | NAME | SHIFT | NEWSHIFT | S/N | NAME | SHIFT | NEWSHIFT | S/N |
| 0 | 19710071 | 0.481105 | 0.00000 | 19.1626 | 19710070 | 0.00000 | 0.481105 | 19.1535 |
| 1 | 19710075 | 0.477844 | 0.00326100 | 19.2069 | 19710073 | 0.00158120 | 0.479524 | 19.2192 |
| 2 | 19710072 | 0.479857 | 0.00124800 | 19.2049 | 19710074 | 0.000960629 | 0.480144 | 19.2100 |