| Red | Green | Blue | |
| z | 17.64 | ||
| znorm | Inf | ||
| sky | -Inf | -Inf | -NaN |
| S/N | 32.0 | 51.1 | 63.6 |
| S/N(c) | 0.0 | 0.0 | 0.0 |
| SN(E/C) |
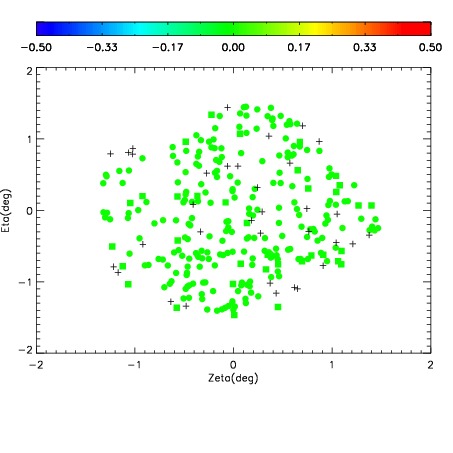
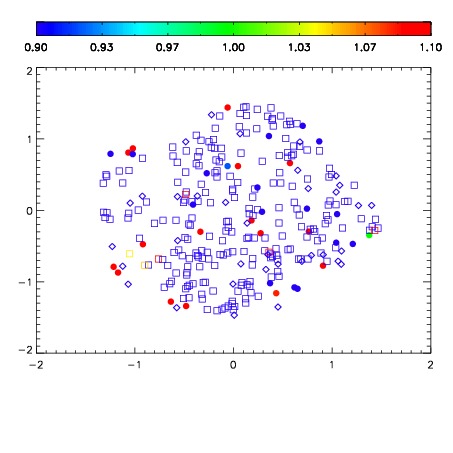
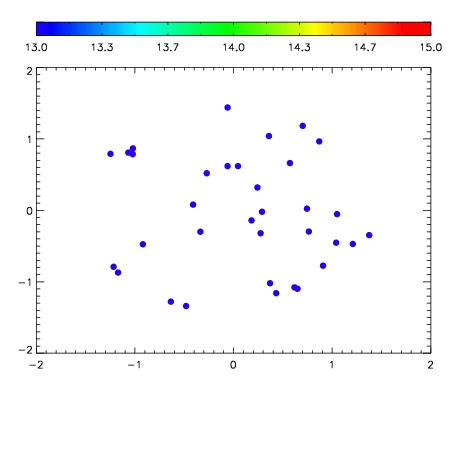

| Frame | Nreads | Zeropoints | Mag plots | Spatial mag deviation | Spatial sky 16325A emission deviations (filled: sky, open: star) | Spatial sky continuum emission | Spatial sky telluric CO2 absorption deviations (filled: H < 10) | |||||||||||||||||||||||
| 0 | 0 |
|
|
|
|
|
|
| IPAIR | NAME | SHIFT | NEWSHIFT | S/N | NAME | SHIFT | NEWSHIFT | S/N |
| 0 | 19670070 | 0.481580 | 0.00000 | 18.9699 | 19670069 | 0.00000 | 0.481580 | 18.9199 |
| 1 | 19670071 | 0.480139 | 0.00144100 | 19.1054 | 19670072 | -0.00383623 | 0.485416 | 19.0952 |
| 2 | 19670074 | 0.477364 | 0.00421599 | 19.0875 | 19670073 | -0.00409079 | 0.485671 | 19.0729 |
| 3 | 19670075 | 0.480386 | 0.00119400 | 19.0669 | 19670076 | -0.00289449 | 0.484474 | 19.0581 |