| Red | Green | Blue | |
| z | 17.64 | ||
| znorm | Inf | ||
| sky | -Inf | -Inf | -NaN |
| S/N | 27.7 | 40.6 | 51.7 |
| S/N(c) | 0.0 | 0.0 | 0.0 |
| SN(E/C) |
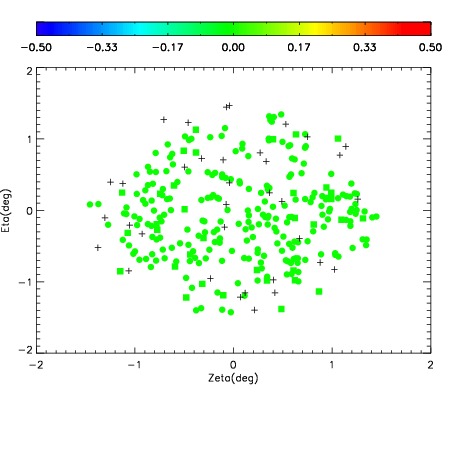
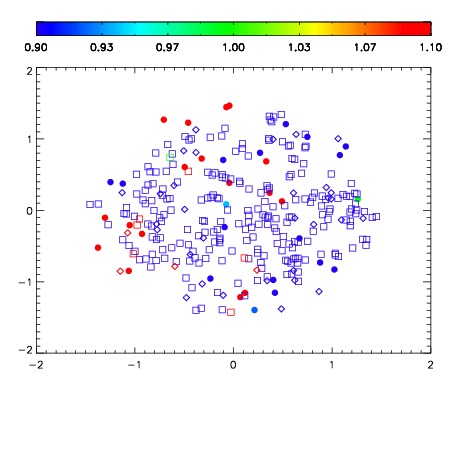
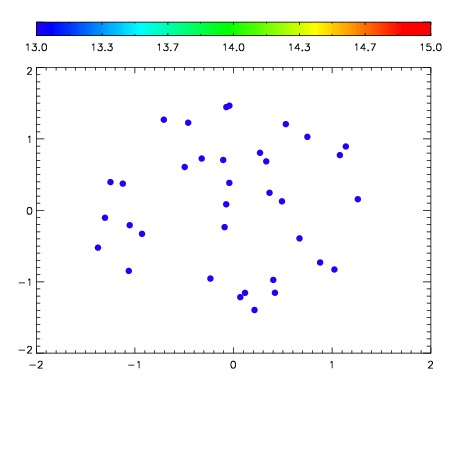

| Frame | Nreads | Zeropoints | Mag plots | Spatial mag deviation | Spatial sky 16325A emission deviations (filled: sky, open: star) | Spatial sky continuum emission | Spatial sky telluric CO2 absorption deviations (filled: H < 10) | |||||||||||||||||||||||
| 0 | 0 |
|
|
|
|
|
|
| IPAIR | NAME | SHIFT | NEWSHIFT | S/N | NAME | SHIFT | NEWSHIFT | S/N |
| 0 | 17340027 | 0.502272 | 0.00000 | 18.1130 | 17340029 | 0.00276556 | 0.499506 | 18.7428 |
| 1 | 17340028 | 0.498043 | 0.00422901 | 18.8539 | 17340022 | 0.00000 | 0.502272 | 18.8776 |
| 2 | 17340024 | 0.498002 | 0.00427002 | 18.7288 | 17340025 | 0.00379738 | 0.498475 | 18.8730 |
| 3 | 17340023 | 0.497290 | 0.00498202 | 18.7163 | 17340026 | 0.00427551 | 0.497997 | 18.7616 |