| Red | Green | Blue | |
| z | 17.64 | ||
| znorm | Inf | ||
| sky | -Inf | -NaN | -NaN |
| S/N | 23.2 | 34.5 | 41.8 |
| S/N(c) | 8.1 | 66.6 | 29.9 |
| SN(E/C) |
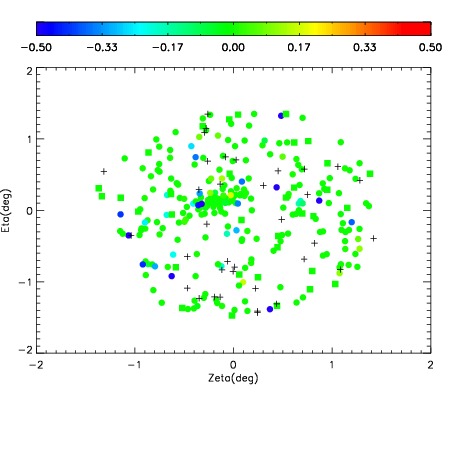
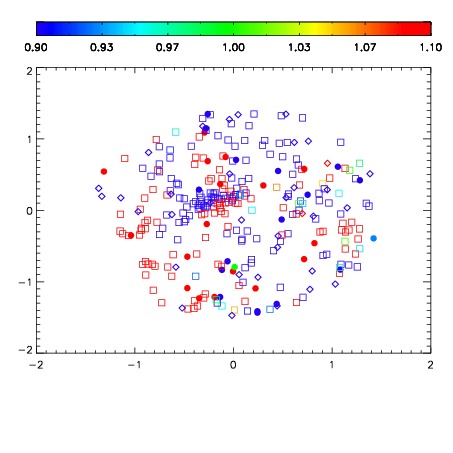
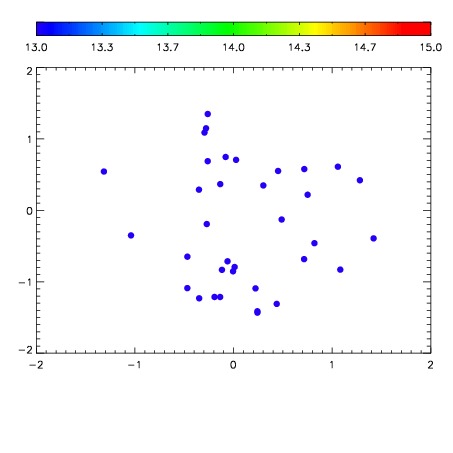

| Frame | Nreads | Zeropoints | Mag plots | Spatial mag deviation | Spatial sky 16325A emission deviations (filled: sky, open: star) | Spatial sky continuum emission | Spatial sky telluric CO2 absorption deviations (filled: H < 10) | |||||||||||||||||||||||
| 0 | 0 |
|
|
|
|
|
|
| IPAIR | NAME | SHIFT | NEWSHIFT | S/N | NAME | SHIFT | NEWSHIFT | S/N |
| 0 | 14930024 | 0.000633731 | 0.00000 | 18.9621 | 14930021 | -0.500483 | 0.501117 | 18.9770 |
| 1 | 14930023 | -7.44376e-05 | 0.000708169 | 18.9763 | 14930025 | -0.499867 | 0.500501 | 18.9921 |
| 2 | 14930020 | 0.00000 | 0.000633731 | 18.9578 | 14930022 | -0.500487 | 0.501121 | 18.9723 |