| Red | Green | Blue | |
| z | 17.64 | ||
| znorm | Inf | ||
| sky | -Inf | -NaN | -NaN |
| S/N | 26.4 | 41.0 | 49.3 |
| S/N(c) | 9.7 | 82.8 | 36.4 |
| SN(E/C) |
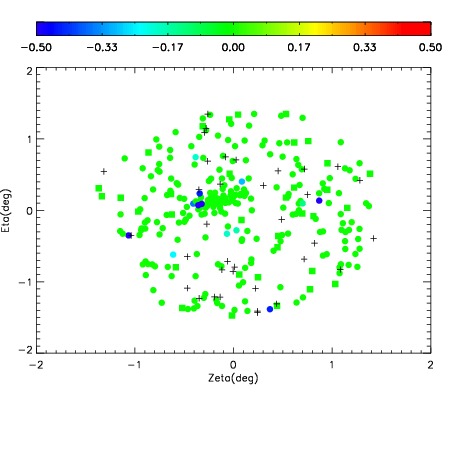
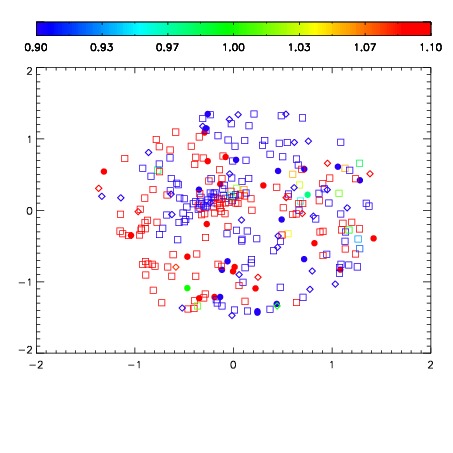
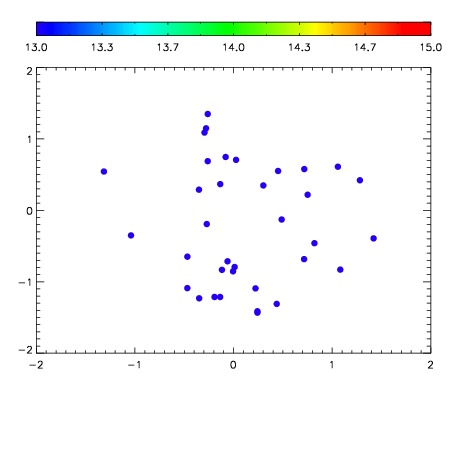

| Frame | Nreads | Zeropoints | Mag plots | Spatial mag deviation | Spatial sky 16325A emission deviations (filled: sky, open: star) | Spatial sky continuum emission | Spatial sky telluric CO2 absorption deviations (filled: H < 10) | |||||||||||||||||||||||
| 0 | 0 |
|
|
|
|
|
|
| IPAIR | NAME | SHIFT | NEWSHIFT | S/N | NAME | SHIFT | NEWSHIFT | S/N |
| 0 | 14940102 | 0.501462 | 0.00000 | 18.8608 | 14940097 | -0.000490601 | 0.501953 | 18.8042 |
| 1 | 14940095 | 0.500645 | 0.000817001 | 18.9659 | 14940101 | -0.000319123 | 0.501781 | 18.9575 |
| 2 | 14940094 | 0.500089 | 0.00137299 | 18.9170 | 14940096 | -0.000680920 | 0.502143 | 18.9234 |
| 3 | 14940099 | 0.500991 | 0.000470996 | 18.8657 | 14940100 | -0.000104530 | 0.501567 | 18.8114 |
| 4 | 14940098 | 0.500446 | 0.00101596 | 18.8217 | 14940093 | 0.00000 | 0.501462 | 18.7624 |