| Red | Green | Blue | |
| z | 17.64 | ||
| znorm | Inf | ||
| sky | -Inf | -Inf | -NaN |
| S/N | 18.3 | 29.4 | 36.2 |
| S/N(c) | 46.4 | 23.6 | 13.6 |
| SN(E/C) |
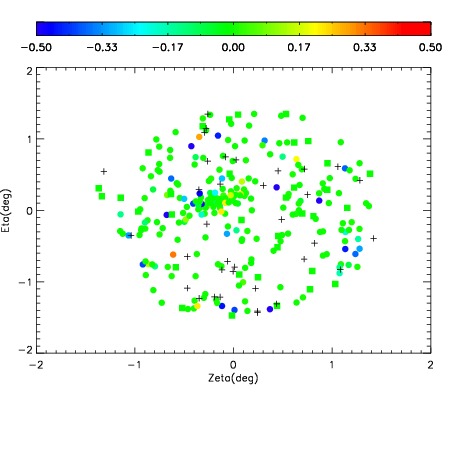

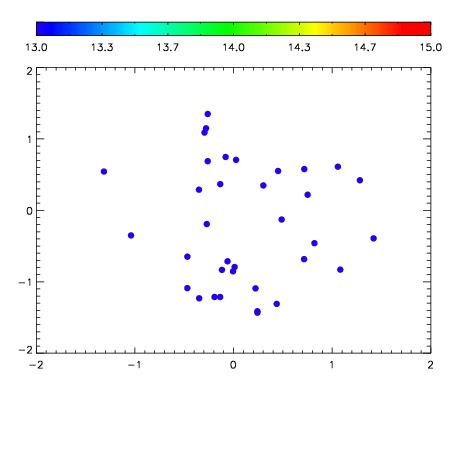

| Frame | Nreads | Zeropoints | Mag plots | Spatial mag deviation | Spatial sky 16325A emission deviations (filled: sky, open: star) | Spatial sky continuum emission | Spatial sky telluric CO2 absorption deviations (filled: H < 10) | |||||||||||||||||||||||
| 0 | 0 |
|
|
|
|
|
|
| IPAIR | NAME | SHIFT | NEWSHIFT | S/N | NAME | SHIFT | NEWSHIFT | S/N |
| 0 | 15020053 | 0.504126 | 0.00000 | 18.6360 | 15020048 | 0.00000 | 0.504126 | 18.7974 |
| 1 | 15020050 | 0.503308 | 0.000818014 | 18.8976 | 15020051 | 0.00247204 | 0.501654 | 18.9678 |
| 2 | 15020049 | 0.502378 | 0.00174803 | 18.8197 | 15020052 | 0.00253416 | 0.501592 | 18.8728 |