| Red | Green | Blue | |
| z | 17.64 | ||
| znorm | Inf | ||
| sky | -Inf | -Inf | -Inf |
| S/N | 27.9 | 41.1 | 49.1 |
| S/N(c) | 11.0 | 35.6 | 65.8 |
| SN(E/C) |
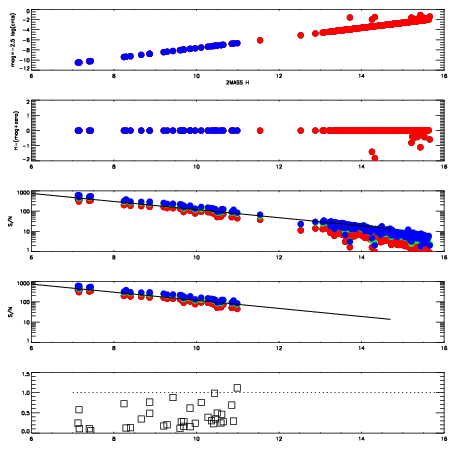
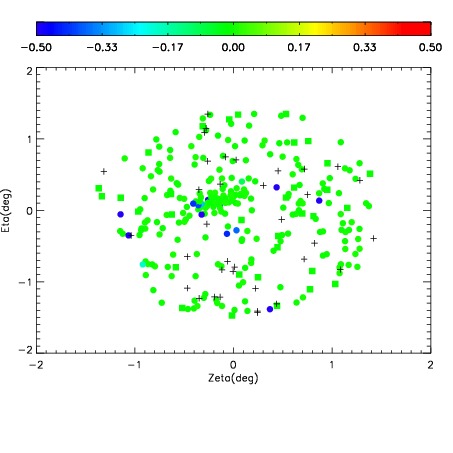
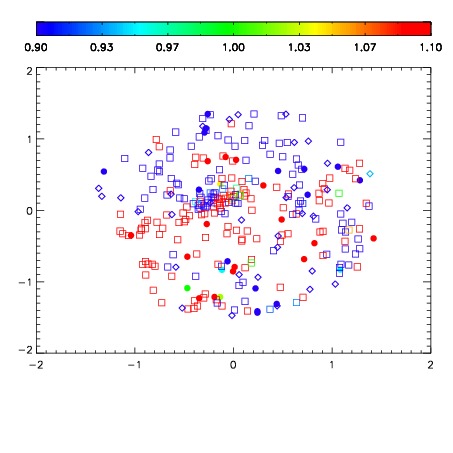
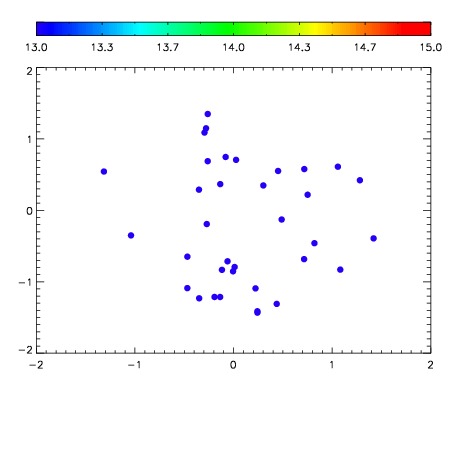

| Frame | Nreads | Zeropoints | Mag plots | Spatial mag deviation | Spatial sky 16325A emission deviations (filled: sky, open: star) | Spatial sky continuum emission | Spatial sky telluric CO2 absorption deviations (filled: H < 10) | |||||||||||||||||||||||
| 0 | 0 |
|
|
|
|
|
|
| IPAIR | NAME | SHIFT | NEWSHIFT | S/N | NAME | SHIFT | NEWSHIFT | S/N |
| 0 | 15300079 | 0.000649301 | 0.00000 | 19.0508 | 15300077 | -0.494836 | 0.495485 | 19.0726 |
| 1 | 15300072 | 0.00000 | 0.000649301 | 19.1407 | 15300073 | -0.493855 | 0.494504 | 19.1721 |
| 2 | 15300075 | -0.000117576 | 0.000766877 | 19.0628 | 15300074 | -0.494995 | 0.495644 | 19.1423 |
| 3 | 15300076 | -0.000270959 | 0.000920260 | 19.0551 | 15300078 | -0.495035 | 0.495684 | 19.0966 |