| Red | Green | Blue | |
| z | 17.64 | ||
| znorm | Inf | ||
| sky | -Inf | -Inf | -NaN |
| S/N | 24.8 | 42.8 | 48.9 |
| S/N(c) | 0.0 | 0.0 | 0.0 |
| SN(E/C) |
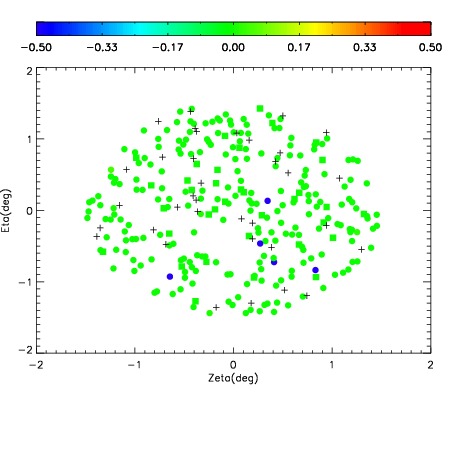
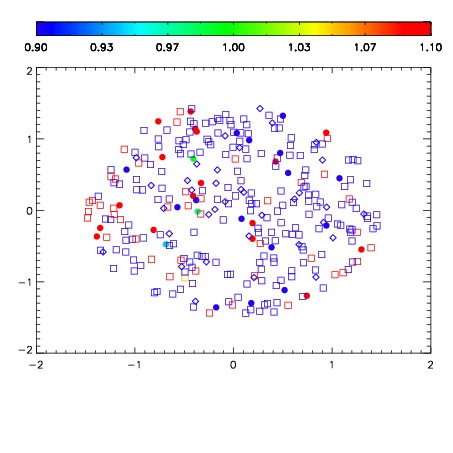


| Frame | Nreads | Zeropoints | Mag plots | Spatial mag deviation | Spatial sky 16325A emission deviations (filled: sky, open: star) | Spatial sky continuum emission | Spatial sky telluric CO2 absorption deviations (filled: H < 10) | |||||||||||||||||||||||
| 0 | 0 |
|
|
|
|
|
|
| IPAIR | NAME | SHIFT | NEWSHIFT | S/N | NAME | SHIFT | NEWSHIFT | S/N |
| 0 | 17290016 | 0.501226 | 0.00000 | 19.0449 | 17290013 | -0.000823479 | 0.502050 | 18.9806 |
| 1 | 17290015 | 0.500583 | 0.000643015 | 19.0530 | 17290017 | -0.00102470 | 0.502251 | 18.9989 |
| 2 | 17290012 | 0.500998 | 0.000227988 | 18.9922 | 17290014 | -0.000758544 | 0.501985 | 18.9776 |
| 3 | 17290011 | 0.499695 | 0.00153100 | 18.9493 | 17290010 | 0.00000 | 0.501226 | 18.8896 |