| Red | Green | Blue | |
| z | 17.64 | ||
| znorm | Inf | ||
| sky | -NaN | -NaN | -NaN |
| S/N | 26.9 | 45.9 | 53.6 |
| S/N(c) | 0.0 | 0.0 | 0.0 |
| SN(E/C) |
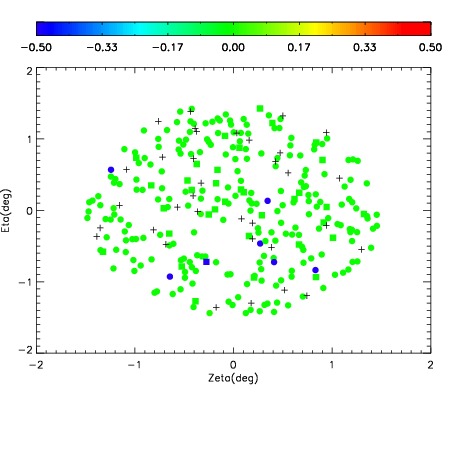
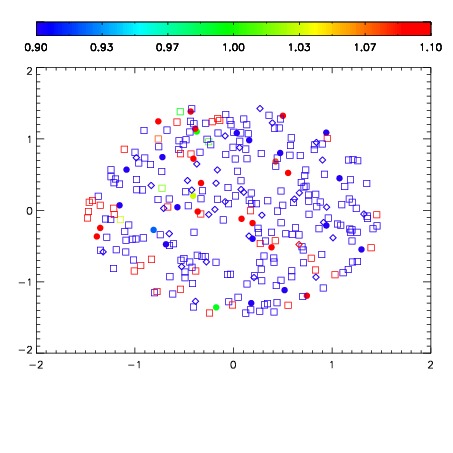
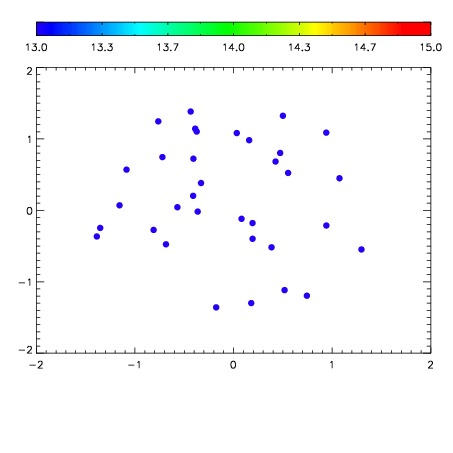

| Frame | Nreads | Zeropoints | Mag plots | Spatial mag deviation | Spatial sky 16325A emission deviations (filled: sky, open: star) | Spatial sky continuum emission | Spatial sky telluric CO2 absorption deviations (filled: H < 10) | |||||||||||||||||||||||
| 0 | 0 |
|
|
|
|
|
|
| IPAIR | NAME | SHIFT | NEWSHIFT | S/N | NAME | SHIFT | NEWSHIFT | S/N |
| 0 | 17320072 | 0.00350095 | 0.00000 | 19.0167 | 17320073 | -0.502311 | 0.505812 | 19.0618 |
| 1 | 17320075 | 0.00272337 | 0.000777580 | 19.1743 | 17320070 | -0.502849 | 0.506350 | 19.1019 |
| 2 | 17320068 | 0.00000 | 0.00350095 | 19.0745 | 17320069 | -0.502132 | 0.505633 | 19.0679 |
| 3 | 17320071 | 0.00292340 | 0.000577550 | 19.0740 | 17320074 | -0.502093 | 0.505594 | 19.0656 |