| Red | Green | Blue | |
| z | 17.64 | ||
| znorm | Inf | ||
| sky | -Inf | -Inf | -Inf |
| S/N | 26.1 | 43.5 | 50.8 |
| S/N(c) | 0.0 | 0.0 | 0.0 |
| SN(E/C) |
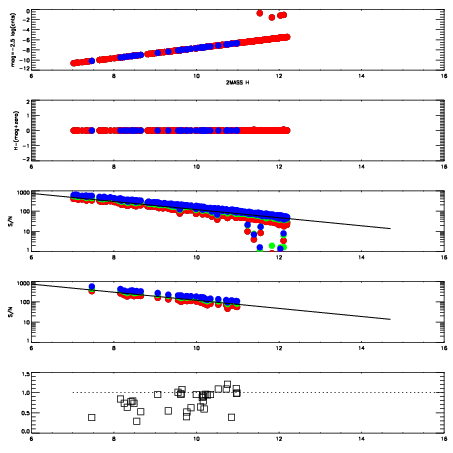
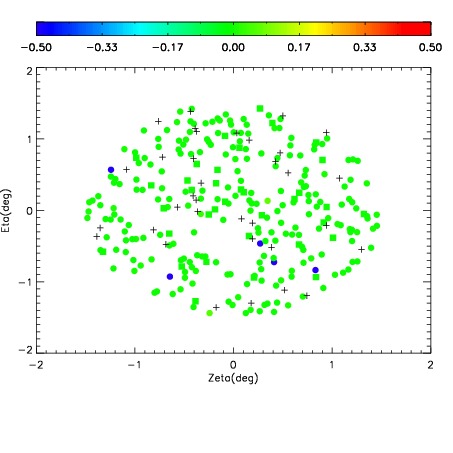
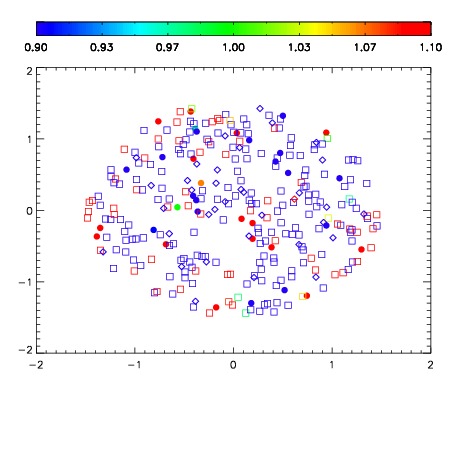
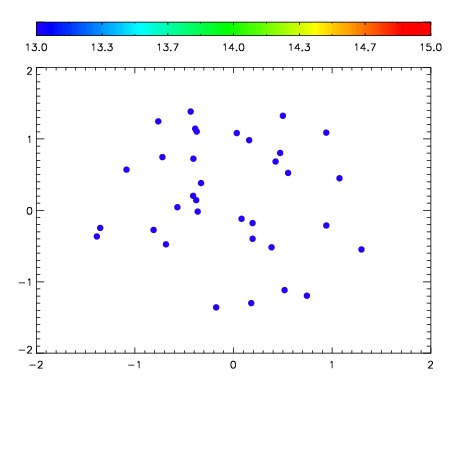

| Frame | Nreads | Zeropoints | Mag plots | Spatial mag deviation | Spatial sky 16325A emission deviations (filled: sky, open: star) | Spatial sky continuum emission | Spatial sky telluric CO2 absorption deviations (filled: H < 10) | |||||||||||||||||||||||
| 0 | 0 |
|
|
|
|
|
|
| IPAIR | NAME | SHIFT | NEWSHIFT | S/N | NAME | SHIFT | NEWSHIFT | S/N |
| 0 | 17610070 | 0.510377 | 0.00000 | 19.0857 | 17610071 | 0.00431989 | 0.506057 | 19.0969 |
| 1 | 17610069 | 0.509246 | 0.00113100 | 19.0521 | 17610067 | 0.00391378 | 0.506463 | 19.0632 |
| 2 | 17610065 | 0.508992 | 0.00138497 | 19.0376 | 17610068 | 0.00343420 | 0.506943 | 18.9057 |
| 3 | 17610066 | 0.509204 | 0.00117302 | 19.0191 | 17610064 | 0.00000 | 0.510377 | 18.9021 |