| Red | Green | Blue | |
| z | 17.64 | ||
| znorm | Inf | ||
| sky | -Inf | -Inf | -Inf |
| S/N | 28.8 | 46.8 | 57.7 |
| S/N(c) | 0.0 | 0.0 | 0.0 |
| SN(E/C) |
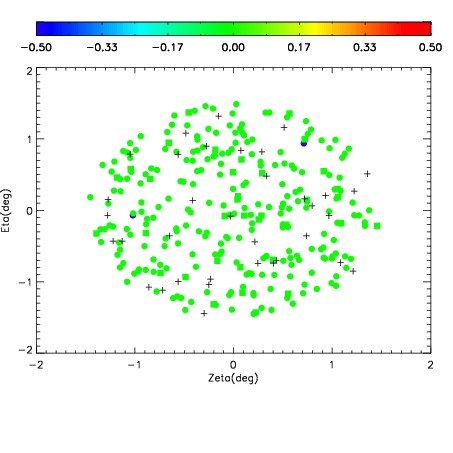
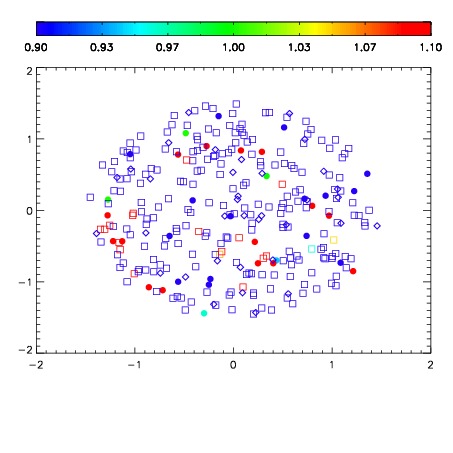
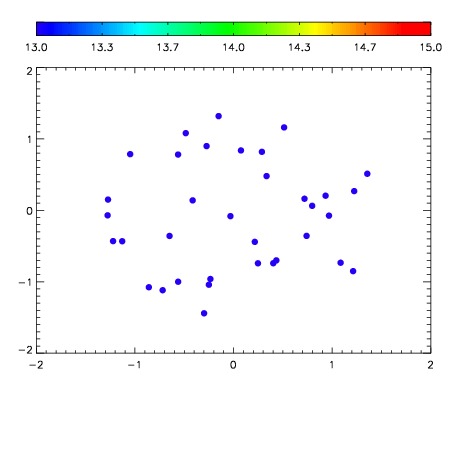

| Frame | Nreads | Zeropoints | Mag plots | Spatial mag deviation | Spatial sky 16325A emission deviations (filled: sky, open: star) | Spatial sky continuum emission | Spatial sky telluric CO2 absorption deviations (filled: H < 10) | |||||||||||||||||||||||
| 0 | 0 |
|
|
|
|
|
|
| IPAIR | NAME | SHIFT | NEWSHIFT | S/N | NAME | SHIFT | NEWSHIFT | S/N |
| 0 | 17030072 | 0.483517 | 0.00000 | 19.0684 | 17030070 | 0.00000 | 0.483517 | 19.0544 |
| 1 | 17030075 | 0.479207 | 0.00430998 | 19.2041 | 17030074 | -0.00153653 | 0.485054 | 19.1806 |
| 2 | 17030076 | 0.479330 | 0.00418699 | 19.1688 | 17030073 | -4.53370e-05 | 0.483562 | 19.1442 |
| 3 | 17030071 | 0.482782 | 0.000734985 | 19.0874 | 17030077 | -0.00137084 | 0.484888 | 19.1017 |