| Red | Green | Blue | |
| z | 17.64 | ||
| znorm | Inf | ||
| sky | -Inf | -NaN | -Inf |
| S/N | 28.7 | 49.2 | 57.6 |
| S/N(c) | 0.0 | 0.0 | 0.0 |
| SN(E/C) |
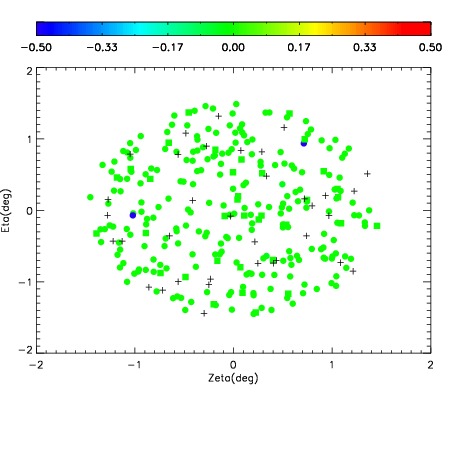
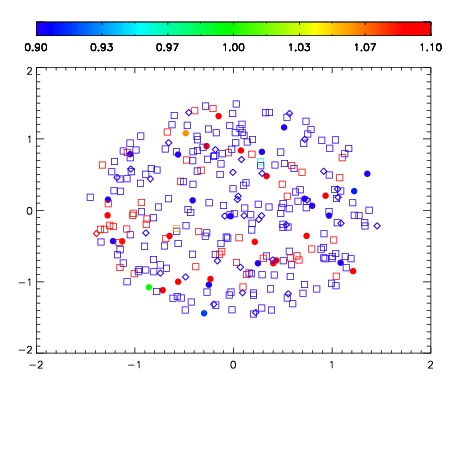
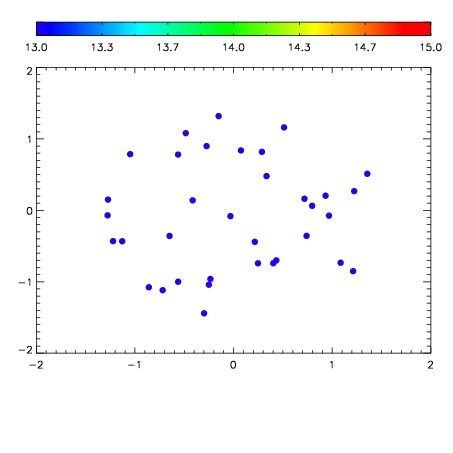

| Frame | Nreads | Zeropoints | Mag plots | Spatial mag deviation | Spatial sky 16325A emission deviations (filled: sky, open: star) | Spatial sky continuum emission | Spatial sky telluric CO2 absorption deviations (filled: H < 10) | |||||||||||||||||||||||
| 0 | 0 |
|
|
|
|
|
|
| IPAIR | NAME | SHIFT | NEWSHIFT | S/N | NAME | SHIFT | NEWSHIFT | S/N |
| 0 | 17300054 | 0.502710 | 0.00000 | 19.2154 | 17300048 | 0.00000 | 0.502710 | 19.2071 |
| 1 | 17300053 | 0.501505 | 0.00120497 | 19.2193 | 17300055 | -0.000588652 | 0.503299 | 19.2253 |
| 2 | 17300050 | 0.501978 | 0.000732005 | 19.2050 | 17300052 | 0.00135729 | 0.501353 | 19.2040 |
| 3 | 17300049 | 0.502298 | 0.000411987 | 19.1639 | 17300051 | 0.000782257 | 0.501928 | 19.1939 |