| Red | Green | Blue | |
| z | 17.64 | ||
| znorm | Inf | ||
| sky | -Inf | -Inf | -NaN |
| S/N | 23.4 | 46.0 | 47.1 |
| S/N(c) | 0.0 | 0.0 | 0.0 |
| SN(E/C) |
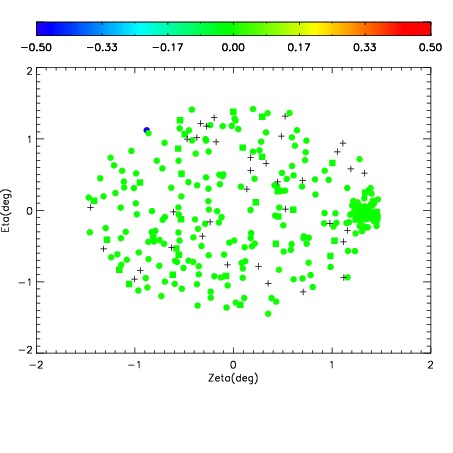
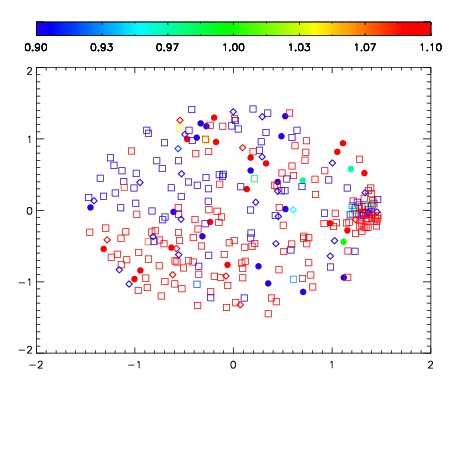


| Frame | Nreads | Zeropoints | Mag plots | Spatial mag deviation | Spatial sky 16325A emission deviations (filled: sky, open: star) | Spatial sky continuum emission | Spatial sky telluric CO2 absorption deviations (filled: H < 10) | |||||||||||||||||||||||
| 0 | 0 |
|
|
|
|
|
|
| IPAIR | NAME | SHIFT | NEWSHIFT | S/N | NAME | SHIFT | NEWSHIFT | S/N |
| 0 | 14600070 | 0.497262 | 0.00000 | 18.4818 | 14600068 | 0.00125391 | 0.496008 | 18.5240 |
| 1 | 14600066 | 0.496511 | 0.000750989 | 18.8219 | 14600075 | 0.000162269 | 0.497100 | 18.6436 |
| 2 | 14600074 | 0.496205 | 0.00105700 | 18.4386 | 14600067 | 0.00108647 | 0.496176 | 18.5013 |
| 3 | 14600073 | 0.495811 | 0.00145102 | 18.3059 | 14600071 | -0.000417722 | 0.497680 | 18.4616 |
| 4 | 14600069 | 0.496923 | 0.000339001 | 18.2664 | 14600064 | 0.00000 | 0.497262 | 18.2736 |
| 5 | 14600065 | 0.496281 | 0.000981003 | 18.2418 | 14600072 | -0.000300345 | 0.497562 | 18.2637 |