| Red | Green | Blue | |
| z | 17.64 | ||
| znorm | Inf | ||
| sky | -Inf | -Inf | -NaN |
| S/N | 29.4 | 52.2 | 55.8 |
| S/N(c) | 0.0 | 0.0 | 0.0 |
| SN(E/C) |


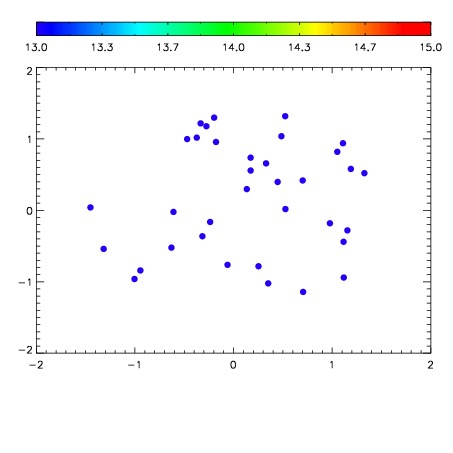

| Frame | Nreads | Zeropoints | Mag plots | Spatial mag deviation | Spatial sky 16325A emission deviations (filled: sky, open: star) | Spatial sky continuum emission | Spatial sky telluric CO2 absorption deviations (filled: H < 10) | |||||||||||||||||||||||
| 0 | 0 |
|
|
|
|
|
|
| IPAIR | NAME | SHIFT | NEWSHIFT | S/N | NAME | SHIFT | NEWSHIFT | S/N |
| 0 | 14960050 | 0.501191 | 0.00000 | 19.0546 | 14960051 | 0.00279381 | 0.498397 | 19.0236 |
| 1 | 14960049 | 0.500333 | 0.000858009 | 19.0776 | 14960048 | 0.00000 | 0.501191 | 19.0801 |
| 2 | 14960054 | 0.501095 | 9.60231e-05 | 19.0645 | 14960055 | 0.00339199 | 0.497799 | 19.0771 |
| 3 | 14960053 | 0.500574 | 0.000617027 | 19.0229 | 14960052 | 0.00211368 | 0.499077 | 19.0106 |