| Red | Green | Blue | |
| z | 17.64 | ||
| znorm | Inf | ||
| sky | -Inf | -Inf | -NaN |
| S/N | 27.4 | 49.5 | 53.3 |
| S/N(c) | 0.0 | 0.0 | 0.0 |
| SN(E/C) |
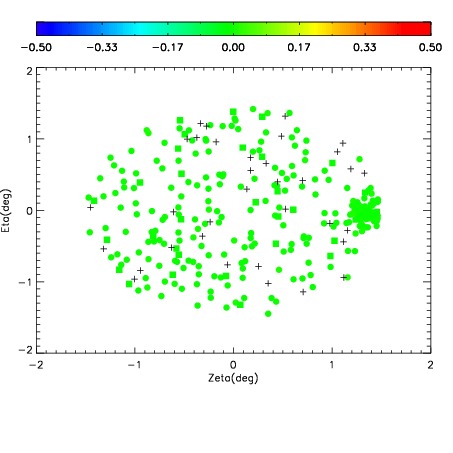

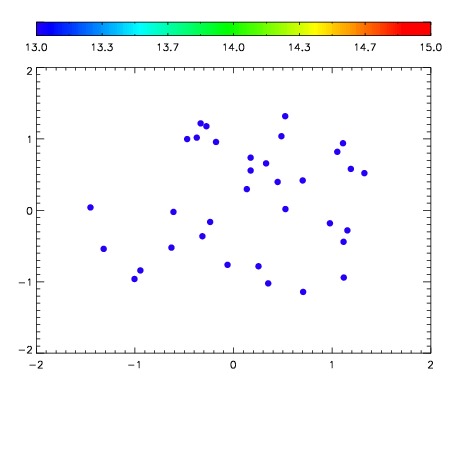

| Frame | Nreads | Zeropoints | Mag plots | Spatial mag deviation | Spatial sky 16325A emission deviations (filled: sky, open: star) | Spatial sky continuum emission | Spatial sky telluric CO2 absorption deviations (filled: H < 10) | |||||||||||||||||||||||
| 0 | 0 |
|
|
|
|
|
|
| IPAIR | NAME | SHIFT | NEWSHIFT | S/N | NAME | SHIFT | NEWSHIFT | S/N |
| 0 | 14990013 | 0.500380 | 0.00000 | 18.9332 | 14990014 | -0.000525655 | 0.500906 | 18.9150 |
| 1 | 14990017 | 0.498896 | 0.00148398 | 18.9400 | 14990018 | 3.28171e-05 | 0.500347 | 19.0257 |
| 2 | 14990012 | 0.500121 | 0.000258982 | 18.8387 | 14990015 | -0.00106156 | 0.501442 | 18.9040 |
| 3 | 14990016 | 0.498576 | 0.00180399 | 18.8203 | 14990011 | 0.00000 | 0.500380 | 18.8400 |