| Red | Green | Blue | |
| z | 17.64 | ||
| znorm | Inf | ||
| sky | -Inf | -Inf | -Inf |
| S/N | 6.7 | 12.8 | 13.3 |
| S/N(c) | 0.0 | 0.0 | 0.0 |
| SN(E/C) |


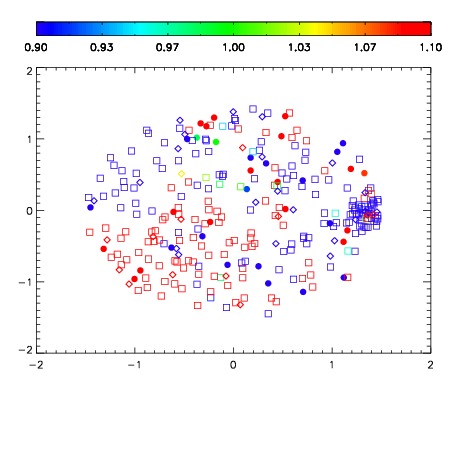


| Frame | Nreads | Zeropoints | Mag plots | Spatial mag deviation | Spatial sky 16325A emission deviations (filled: sky, open: star) | Spatial sky continuum emission | Spatial sky telluric CO2 absorption deviations (filled: H < 10) | |||||||||||||||||||||||
| 0 | 0 |
|
|
|
|
|
|
| IPAIR | NAME | SHIFT | NEWSHIFT | S/N | NAME | SHIFT | NEWSHIFT | S/N |
| 0 | 15190027 | 0.509615 | 0.00000 | 15.4963 | 15190026 | 0.00159575 | 0.508019 | 16.2795 |
| 1 | 15190023 | 0.508630 | 0.000985026 | 17.9895 | 15190022 | 0.00000 | 0.509615 | 17.8073 |
| 2 | 15190024 | 0.509336 | 0.000279009 | 17.2256 | 15190025 | 0.00172708 | 0.507888 | 16.8902 |