| Red | Green | Blue | |
| z | 17.64 | ||
| znorm | Inf | ||
| sky | -Inf | -Inf | -NaN |
| S/N | 29.5 | 51.0 | 55.6 |
| S/N(c) | 0.0 | 0.0 | 0.0 |
| SN(E/C) |
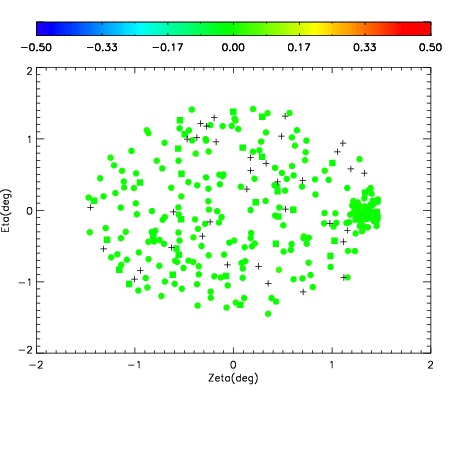
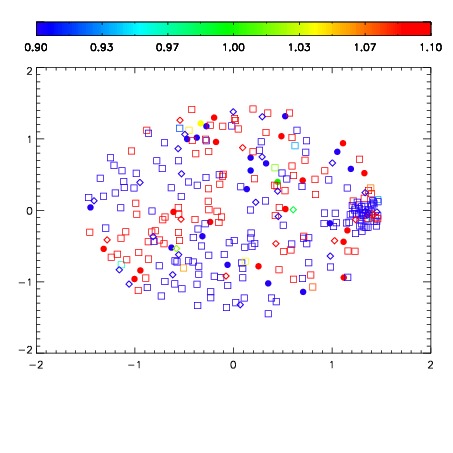
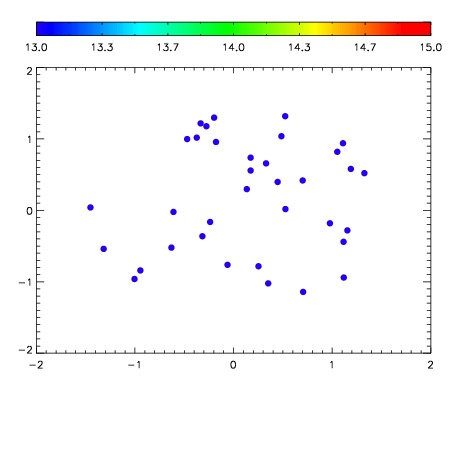

| Frame | Nreads | Zeropoints | Mag plots | Spatial mag deviation | Spatial sky 16325A emission deviations (filled: sky, open: star) | Spatial sky continuum emission | Spatial sky telluric CO2 absorption deviations (filled: H < 10) | |||||||||||||||||||||||
| 0 | 0 |
|
|
|
|
|
|
| IPAIR | NAME | SHIFT | NEWSHIFT | S/N | NAME | SHIFT | NEWSHIFT | S/N |
| 0 | 15250032 | 0.510162 | 0.00000 | 18.8601 | 15250033 | 0.000952645 | 0.509209 | 18.8950 |
| 1 | 15250028 | 0.508729 | 0.00143301 | 19.0737 | 15250026 | 0.00000 | 0.510162 | 19.0525 |
| 2 | 15250027 | 0.508462 | 0.00169998 | 19.0666 | 15250029 | 0.000248483 | 0.509914 | 19.0357 |
| 3 | 15250031 | 0.509134 | 0.00102800 | 18.9677 | 15250030 | 0.000178469 | 0.509984 | 18.9676 |