| Red | Green | Blue | |
| z | 17.64 | ||
| znorm | Inf | ||
| sky | -Inf | -NaN | -Inf |
| S/N | 28.7 | 47.9 | 55.7 |
| S/N(c) | 0.0 | 0.0 | 0.0 |
| SN(E/C) |
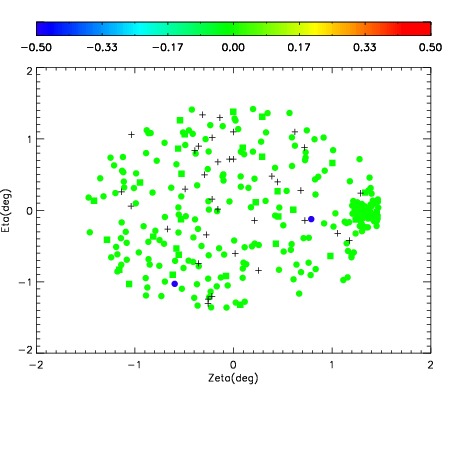
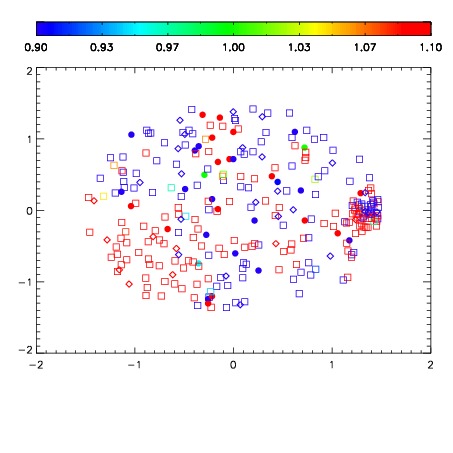
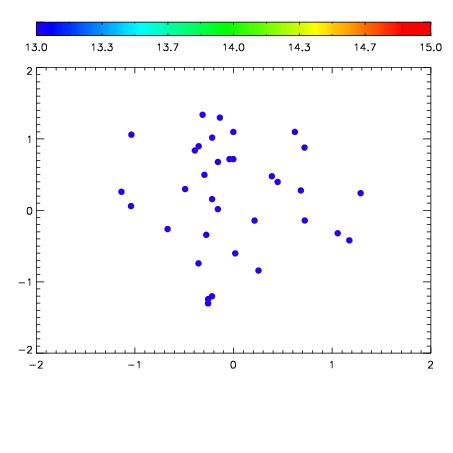

| Frame | Nreads | Zeropoints | Mag plots | Spatial mag deviation | Spatial sky 16325A emission deviations (filled: sky, open: star) | Spatial sky continuum emission | Spatial sky telluric CO2 absorption deviations (filled: H < 10) | |||||||||||||||||||||||
| 0 | 0 |
|
|
|
|
|
|
| IPAIR | NAME | SHIFT | NEWSHIFT | S/N | NAME | SHIFT | NEWSHIFT | S/N |
| 0 | 15570013 | 0.490824 | 0.00000 | 19.0787 | 15570014 | -0.000352028 | 0.491176 | 19.1030 |
| 1 | 15570016 | 0.488792 | 0.00203201 | 19.0471 | 15570015 | -0.000755465 | 0.491579 | 19.0790 |
| 2 | 15570012 | 0.490572 | 0.000252008 | 19.0350 | 15570011 | 0.00000 | 0.490824 | 19.0604 |
| 3 | 15570017 | 0.489134 | 0.00169000 | 18.8853 | 15570018 | -0.000493278 | 0.491317 | 18.9542 |