| Red | Green | Blue | |
| z | 17.64 | ||
| znorm | Inf | ||
| sky | -Inf | -Inf | -Inf |
| S/N | 24.8 | 44.7 | 51.2 |
| S/N(c) | 0.0 | 0.0 | 0.0 |
| SN(E/C) |
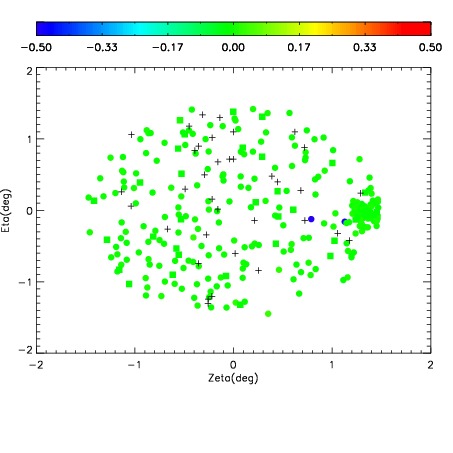
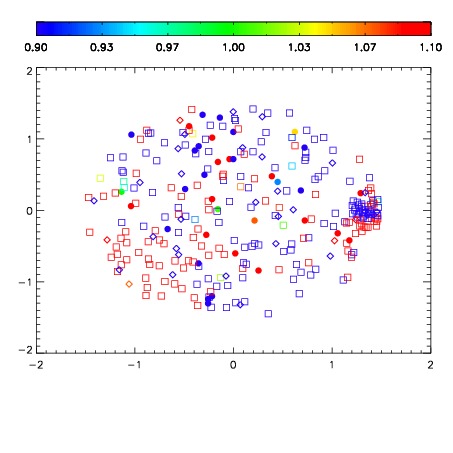
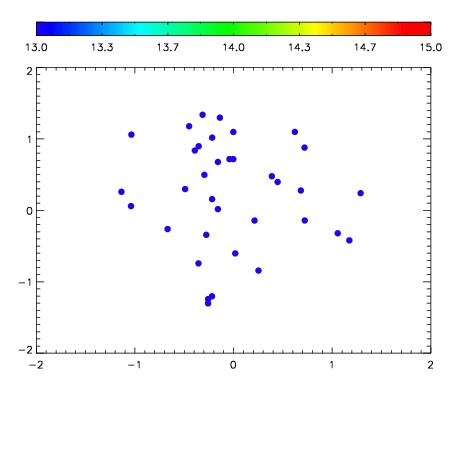

| Frame | Nreads | Zeropoints | Mag plots | Spatial mag deviation | Spatial sky 16325A emission deviations (filled: sky, open: star) | Spatial sky continuum emission | Spatial sky telluric CO2 absorption deviations (filled: H < 10) | |||||||||||||||||||||||
| 0 | 0 |
|
|
|
|
|
|
| IPAIR | NAME | SHIFT | NEWSHIFT | S/N | NAME | SHIFT | NEWSHIFT | S/N |
| 0 | 17610103 | 0.510258 | 0.00000 | 19.0237 | 17610100 | 0.00407630 | 0.506182 | 18.9908 |
| 1 | 17610102 | 0.509472 | 0.000786006 | 19.0363 | 17610104 | 0.00838256 | 0.501875 | 19.0572 |
| 2 | 17610099 | 0.508019 | 0.00223905 | 18.9647 | 17610101 | 0.00490707 | 0.505351 | 18.9622 |
| 3 | 17610098 | 0.507660 | 0.00259805 | 18.8795 | 17610097 | 0.00000 | 0.510258 | 18.6919 |