| Red | Green | Blue | |
| z | 17.64 | ||
| znorm | Inf | ||
| sky | -Inf | -Inf | -NaN |
| S/N | 31.5 | 53.7 | 58.8 |
| S/N(c) | 0.0 | 0.0 | 0.0 |
| SN(E/C) |
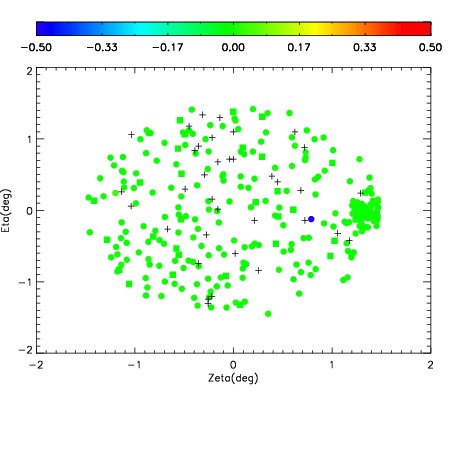
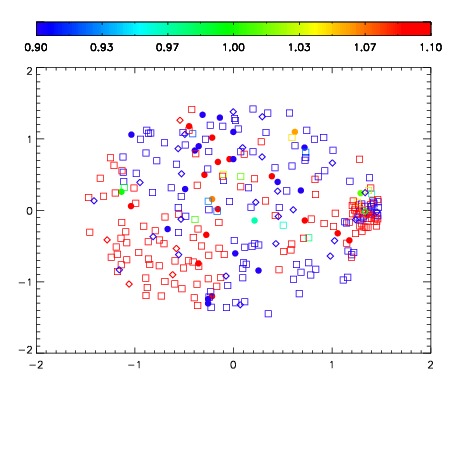
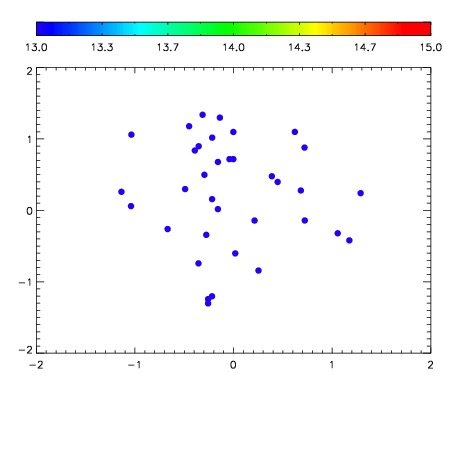

| Frame | Nreads | Zeropoints | Mag plots | Spatial mag deviation | Spatial sky 16325A emission deviations (filled: sky, open: star) | Spatial sky continuum emission | Spatial sky telluric CO2 absorption deviations (filled: H < 10) | |||||||||||||||||||||||
| 0 | 0 |
|
|
|
|
|
|
| IPAIR | NAME | SHIFT | NEWSHIFT | S/N | NAME | SHIFT | NEWSHIFT | S/N |
| 0 | 17880098 | 0.496928 | 0.00000 | 19.0426 | 17880099 | -0.00298553 | 0.499914 | 19.0861 |
| 1 | 17880101 | 0.495866 | 0.00106201 | 19.1563 | 17880103 | -0.00811124 | 0.505039 | 19.1745 |
| 2 | 17880102 | 0.496424 | 0.000504017 | 19.1552 | 17880100 | -0.00297355 | 0.499902 | 19.1624 |
| 3 | 17880097 | 0.496751 | 0.000176996 | 19.1045 | 17880096 | 0.00000 | 0.496928 | 19.1353 |