| Red | Green | Blue | |
| z | 17.63 | ||
| znorm | Inf | ||
| sky | -NaN | -NaN | -NaN |
| S/N | 28.6 | 50.0 | 55.0 |
| S/N(c) | 0.0 | 0.0 | 0.0 |
| SN(E/C) |
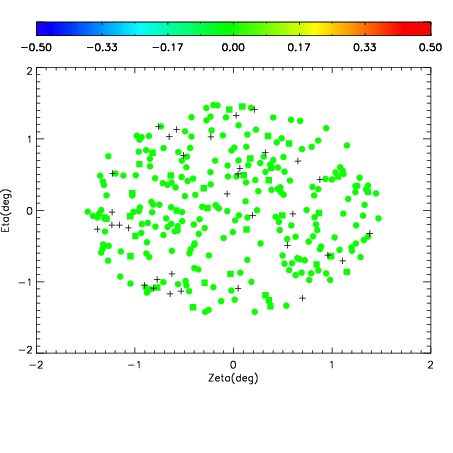
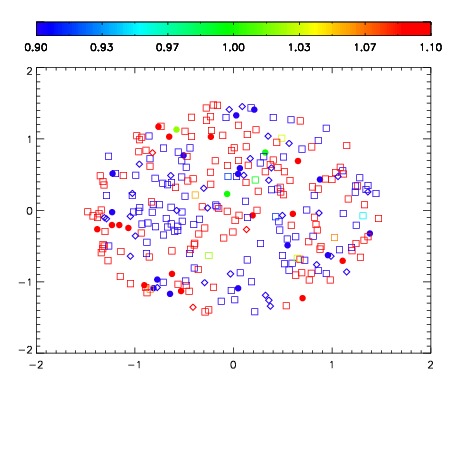
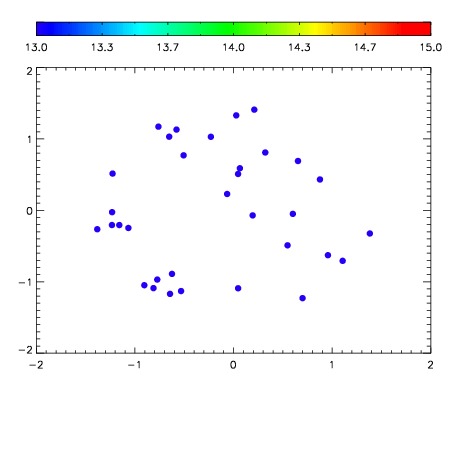

| Frame | Nreads | Zeropoints | Mag plots | Spatial mag deviation | Spatial sky 16325A emission deviations (filled: sky, open: star) | Spatial sky continuum emission | Spatial sky telluric CO2 absorption deviations (filled: H < 10) | |||||||||||||||||||||||
| 0 | 0 |
|
|
|
|
|
|
| IPAIR | NAME | SHIFT | NEWSHIFT | S/N | NAME | SHIFT | NEWSHIFT | S/N |
| 0 | 14650091 | 0.496003 | 0.00000 | 19.1436 | 14650088 | 0.000960099 | 0.495043 | 19.1101 |
| 1 | 14650086 | 0.493447 | 0.00255600 | 19.1636 | 14650089 | 0.00219302 | 0.493810 | 19.1745 |
| 2 | 14650090 | 0.495488 | 0.000515014 | 19.1568 | 14650092 | 0.00163219 | 0.494371 | 19.1544 |
| 3 | 14650087 | 0.493614 | 0.00238901 | 19.1458 | 14650085 | 0.00000 | 0.496003 | 19.1374 |