| Red | Green | Blue | |
| z | 17.64 | ||
| znorm | Inf | ||
| sky | -NaN | -Inf | -NaN |
| S/N | 21.3 | 37.8 | 42.3 |
| S/N(c) | 0.0 | 0.0 | 0.0 |
| SN(E/C) |

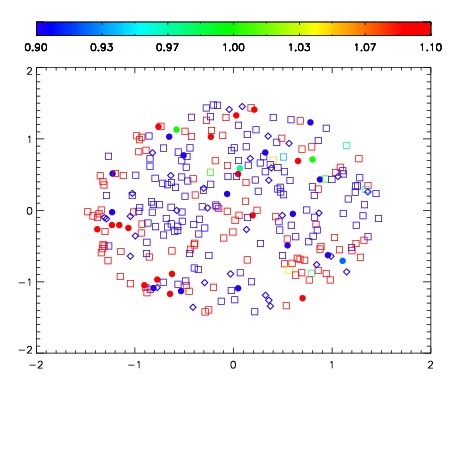


| Frame | Nreads | Zeropoints | Mag plots | Spatial mag deviation | Spatial sky 16325A emission deviations (filled: sky, open: star) | Spatial sky continuum emission | Spatial sky telluric CO2 absorption deviations (filled: H < 10) | |||||||||||||||||||||||
| 0 | 0 |
|
|
|
|
|
|
| IPAIR | NAME | SHIFT | NEWSHIFT | S/N | NAME | SHIFT | NEWSHIFT | S/N |
| 0 | 14960065 | 0.498723 | 0.00000 | 18.9484 | 14960062 | 0.00116523 | 0.497558 | 18.9758 |
| 1 | 14960061 | 0.498588 | 0.000135005 | 18.9666 | 14960066 | -0.00170086 | 0.500424 | 19.0493 |
| 2 | 14960060 | 0.497408 | 0.00131500 | 18.9134 | 14960059 | 0.00000 | 0.498723 | 18.9477 |
| 3 | 14960064 | 0.498030 | 0.000692993 | 18.7190 | 14960063 | 0.00113334 | 0.497590 | 18.9417 |